Continue to Site

Eng-Tips is the largest engineering community on the Internet

Intelligent Work Forums for Engineering Professionals

  • Congratulations KootK on being selected by the Eng-Tips community for having the most helpful posts in the forums last week. Way to Go!

stresses in framed structures

chthulu

Student
May 7, 2025
20
Hi,
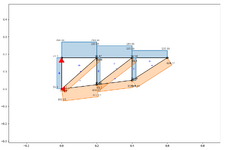
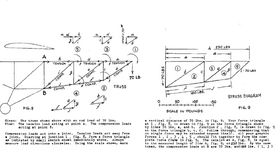
In the picture that follows, is fig 9 correct?
Using the scale in pounds shown there, the 70LBS line seems to be correct, where line a seems to be more or less 110 lbs and line b seems to be more or less 130 lbs, but using trigonometry I got something else for a and b.
So, is it possible to get a and b through trigonometry?
If you draw the line for the 70lbs according to the scale in pounds, how do you know where to stop when drawing a? or b? if you start from b.
I mean line a could be any length and fig 8 does not indicate how long line a should be.
What would be the best way to add the sketch of fig 8 together?
I really do not understand even how the 180 and 230 lbs are get.
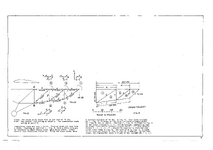
stress diagram.png
 
Replies continue below

Recommended for you

you say you made a FEM of the structure ... how did you place the nodes in the FEM ??
 
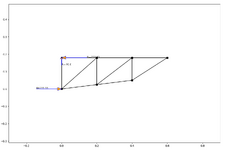
Attached is the analysis, I simply printed the fig. 8, with a ruler checked the important sides and then with the online truss calculator I generated the output.
For instance line c is 1.3 cm so in the online truss calculator that uses meters I put 0.13
Here are the two output.


Axilforcelatest).pngReactionsLatest.png
 

Attachments

  • Expenses2025-05-09 14-18-01.491046.pdf
    204.6 KB · Views: 2
ok, you used the member lengths to determine the position of the joints. so now the joints have a position in space, and so co-ordinates. So you could ask the FEM where the nodes are. But this doesn't matter.

Having drawn the last bay as you have, then you know the answer (to the lengths of each side). You could construct it by drawing the vertical line first, a horizontal line through the top point. And from fig 8 measure the inclination of the diagonal line and draw a corresponding line. This will work out like your FEM, since you measured the lengths of each line, you know the vertical line represents 70 lbs, so scale for the other members.

Then move on to joint 2 ... you already have the inclined member, drop a vertical from the far end of the inclined line, draw a line representing the lower slightly inclined member.

If you're not understanding this, maybe Will (a fellow kit builder and hobbyist) can help more than I can.
 

Attachments

  • Doc1.pdf
    51.1 KB · Views: 4
no, at the end I was not able to do it graphically, so I have done as above and save the day.
I will wait for someone to show me how is properly done graphically.
 
The diagram is, AS THE ORIGINAL TEXT states, a superposition of all the joint diagrams, and I have explained how to construct it in one of my posts. I don't teach stupid.
 
I can follow instructions, but there is no way that I can accurately copy those triangles, the angle between c and b seems to be 45 degree and I am not even sure of that (actually is between 56 and 57 so no way that I would get it right ), even worse with triangles e,c,f and i,g,J where the angles are different, event the slightest mistake will not allow you to get the results that he get in that picture, namely 230, 180 and 70 lbs. Maybe an artist or someone that has done it millions of time will be able to draw the inclination of J and f accurately, but not me, so I conclude that graphically its not for me.
The thing is not how to put triangles together, because it is shown in fig. 9, the issue is how to get the right inclination of line J and line f.
 
Last edited:
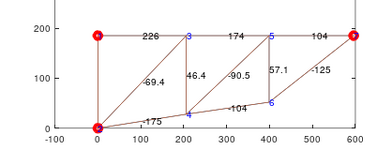
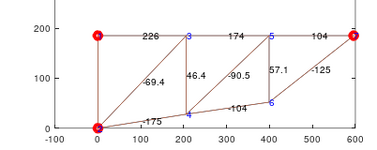
Well, if you finally get around to doing it properly you should get something like this for the bar forces. I got the geometry by cursoring figure 8
Coord=[0 185 0;0 0 0; 206 185 0;206 28 0;399 185 0;399 52 0;596 185 0]; % coordinates of nodes
Con=[1 2; 2 3; 3 1; 4 2; 3 4;3 5; 4 5; 4 6; 6 5;5 7;6 7]; %connectivity of beams
A maxwell diagram is merely the polygon of forces at each joint superimposed, as the original text and at least one subsequent post tells you.

1746838011062.png

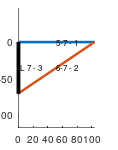
Here's the force polygon for node 7 where the 70 lb force is applied

1746839072600.png
 
yes accurately copying the structure is the problem with graphical methods like this.

ok, you say you can follow directions; the directions in your post and in my posts have been pretty clear. I think the problem is in carefully measuring the angle of the structure. Ok, why not make life easy for yourself, and make your own structure, something like the original, but with dimensions that make it easy to measure angles. Actually I think you are very close to this, with your FEM (back on past 10). The results are close to fig 9, so the dimensions are pretty accurate.

I understand you didn't input dimensions, but rather member lengths, ok fine.
point 1 is at (0,0)
point 2 (0,1)
point 3 (1,1) (but if you want to get the 230 lbs this should be closer to (1.1,1) (i get 1.095,1)
point 4 (2,1) or (2.2,1) or (2.19,1)
point 5 (3,1) or (3.3,1) or (3.285,1) these will give 210, 231, or 230
point 6 (1, 0.1) or something like
point 7 (2, 0.2)
obviously make 6 and 7 under 2 and 3
whatever dimensions, verify the member lengths (and fine tune)

now you can see the slope of the member at the RH end is 0.8/1 (or something like depending on where you place things)
so now you can work through the graphical method. You should be trying to understand the procedure, rather than getting the exactly same answers (particularly as you can analyze this a different way and confirm your answers). if you post your work here we may help out.

I think you are having trouble with basic concepts and analysis, or maybe it was just not being able to get an accurate angle. Angles aside I didn't see much in the discussion about working through the method (but it could be that in having trouble with the initial steps that you got thrown.

Do you understand a Free Body Diagram, and the equations of equilibrium (or static equilibrium) ?
 
"Do you understand a Free Body Diagram, and the equations of equilibrium (or static equilibrium) ?"

Yes, I do.
Yes, the problem with the graphical approach is to get the angle correct, I used digimizer just for the angle between line c and line b of fig. 8 and even with digimizer I could not get the right angle; as I said is between 56 and 57 degree. So the Cremona/Maxwell approach works well if you have a clean draw.

"I understand you didn't input dimensions, but rather member lengths, ok fine."

Well it is the same as dimensions, but smaller, because I measured all the sides of fig. 8 with a rules.
Of course in the real draw it would be so small, but does not matter, because even if the measurements are not accurate I get a result close to what the picture says, so I get 233.33 instead of 230 for line h, -182.05 instead of -180 for line J and -70.88 instead of -70 for line i, and I guess it is due to the imperfection of the measurements.

"I think you are having trouble with basic concepts and analysis"
No, I am not. This has nothing to do with basic concepts and analysis, maybe you guys will be able to get the angles correctly, but not me, I am not a magician or an artist or someone that has done that millions of time and therefore has an eye for it. I challenge everyone to get that 56-57 degree angle correct at first sight.
Yes you could try over and over and over again until you get 230 for h, 180 for J and 70 for i, but what would be the point?

As for this:

1746838011062.png

I do not understand what you have done, since the results are completely incorrect, mine are much much closer.


Anyway, this is an exercise in futility, since the drawing is imperfect, the fuselage is a 3d structure and not a 2d structure and also you need to be very good to get the angles correctly.

So, to sum up, is just a way to learn about struss structures.
 
there's a forest and some trees, and you've gotten hung up on a tree.

replicating an example of a method is one thing, IMHO a very minor thing, in learning a method.

for one thing, instead of measuring an angle, you could have digitised the image, imported it into some CAD program, deconstructed it into lines and moved the lines to create the diagram. And yes I realise that these tools would solve the structure (so why bother ? to learn this graphical approach to solving the structure.) And still you're answer would have been slightly different, because of the intolerance of the method to slightly different interpretations of the structure.

Understanding FBDs, you could've worked backwards from the solution to determine the angles used in the original graphic, or that least a set of angles that would give you the answer. And like I've said you could build your own simpler example just to "play" with this method.

and think about applying this to a real structure. For a real structure you'd've dimensions (else how could you build it) so you wouldn't be copying an angle from some picture.

IMHO, a sensible question would have been ... I'm trying to replicate this example, but my results are different. Here's what I've done, eg I measured this angle as 57 degrees; are my results right ? mind you there are several ways to analyze a structure so you can check your own work.

And yes, "to sum up, this is just a way to learn about truss structures". We use tools that we like, I would use something like excel, others would use CAD, we'll all get the right answer in the end. One thing, I don't think this method works with indeterminate trusses, so that's a limitation to be aware of.
 
I was puzzled by that page, because I never found anything like that about truss fuselage anywhere ever.

The challenge was:
Given: The truss shown above with an end load of 70 lbs.
Find: The tension load acting at point A. The compression loads acting at point B.

But the guy makes it easy by saying:
Using the scale shown, mark a vertical distance of 70 lbs. in fig. 9. Your force triangle at 1, fig. 8, is drawn in fig. 9 as the force triangle shown by lines 70 lbs, a, and b.

Are you kidding me? I can not replicate that just by sight, and because at the time of Cremona/Maxwell there were not CADs, I guess would have been more easier having a proper Engineering drawings.

I do not need a CAD, a can use software to read distance and angles, but because it is a pdf/image will never be as it was an original engineering drawings, so you will never get the correct values.

So, I decided to not use the Cremona/Maxwell diagram and to use an online truss calculator with the dimensions red by some software and it ended up pretty similar to what he gives, namely 230,180,70.

Anyway am I correct to assume that A is pinned and B is vertical roll?
 
Last edited:
"Anyway am I correct to assume that A is pinned and B is vertical roll?" ... yes, good assumption.

but the method has (or had) applicability and is very applicable if you want to quickly check some results.
I think the point is knowing how (and why) to construct the diagram, the idea that forces and lengths can have the same relationship (based on trig),
and so the ratio of lengths is the same as the ratio of forces for two different members.

The example is tricky because fig 9 is actually the opposite of fig 8 (even though they look alike) ... the loaded end is at the RH end of fig 8 but is the LH end of fig 9.

Understand the general principle, then tweek to get the right results ... how long is a specific member ? what angle ? your work is only as good as your measurements (an issue with this type of analysis, but if a length is 10, or 10.1 it'll slightly change the answer but the principle is the same.

In the olde days, someone would've drawn the truss, then analyzed it on the same sheet, by just projecting parallel lines from the drawing without measuring them.
 
Actually there is a simple way to do it with Cremona/Maxwell diagram, but for same strange reason does not give the same results the author got.
He says: "Starting at junction 1, fig. 8, form a force triangle as indicated by small sketch shown immediately above. Always measure load directions clockwise. Using the scale shown, mark a vertical distance of 70 lbs. in fig. 9. Your force triangle at 1, fig. 8, is drawn in fig. 9 as the force triangle shown by lines 70 lbs, a, and b."

Well with a cad or even with paint or some online tool like imageJJS, I can cut triangle a,b,c of fig. 8, I do not need a scale in pounds, because I can use the measure of side c of that triangle, that on the paper is 1.3 cm, so assuming 70 LBS as side c, you have 70/1.3 = more or less 53.85 lbs/cm, then you cut and paste the other triangles of fig. 8 until you get what is on fig. 9, but when you measure what is labelled h on fig. 9, you do not get 230 lbs; strange.

At the end line h of fig. 9 is not other than line a plus line d plus line h of fig. 8, but when you add those measurements, you do not get 230, namely: 2 + 2 + 2 = 6 -> 6 x 53.8 = a lot more than 230 lbs.

Is there any explanation for that?
 
yes, see my sketch (post 23). Nodes 1 and 2 are simple triangles, but node 3 is tricky because it has 4 forces. You have an inclined member and a vertical member, and the 3rd side of the triangle is formed by the difference of the two horizontal members ... the load from node 1 is directed away from the triangle and the load towards node 5 completes the triangle (so that the load in 3-5 is higher than the load in 1-3. Fig 9 show this somewhat cryptically, but when you know this you can read it in fig 9 !

clear as mud ?? I can hear a "WTF", but it makes sense ... the upper chord is in tension, tension is shown by loads acting inwards to the span (just as compression loads are arrows pointing away from the span ... as I was told so many years ago, picture a man (or woman or other, sigh) being pressed by two walls ... he'd be pushing against them with his (/her/?) arms and he'd be under compression. Thus at node 3 the two horizontal forces are pointing in opposite directions (because they represent tension in different spans).

No, I'm not making this up !
 
Yes, but the fact remains that in fig. 8, a + d + h should be = 230 lbs if you assume c as being 70 lbs, but it does not; Why? Instead h and J in fig.9 are correct, when you use the scale in pounds.
 
no ! ... h = 230 lbs ... a, d, and h are colinear but separate.

if you're saying your measurement of "h" is off, ie not equal to 230/70*c then ok. it could be that the copying of the original sketch is off.
again, this is a problem with graphical solutions, particularly when they don't define the lengths and angles.

if you want to work this, make your own truss, with your own known lengths and angles so you can build the load figure exactly.
 
Bear with me, do you agree that h line of fig. 9 is nothing else than line a + d + h of fig 8?
Now, if you instead of using the scale in pounds provided, use the natural scale of fig. 8, and I mean line c is 1.3 cm measured with a ruler, so 70lbs/1.3 = more or less 53.85. You cut and paste all the triangles of fig.8 and put somewhere in order to re-create the fig. 9, then you measure line h of the new fig. 9 and you do not get the same value, namely a + d + h = 2cm + 2cm + 2cm = 6cm x 53.85lbs/cm = not 230 lbs, can you explain why?
 
Why? If there is a difference between sets of answers then one or all of the solutions are flawed.

To answer the "why" is to say people make errors.

Does graphical vector resolution for this sort of problem work? Yes. Errors should run <5% which is close enough.

Your mistake appears to be the belief that the physical lengths of truss members in Figure 8 are the same as the magnitudes of the forces in Figure 9.

I suspect this because you use the same lengths for each of them in " a + d + h = 2cm + 2cm + 2cm" when clearly in Figure 9 none of force vectors a, d, h are the same length. They don't even add up in Figure 9, but are overlayed. Magnitude of h in figure 9 is not a + d + something.

truss.PNG
 
for gosh sake, maybe the reprinting for the figures has spoilt the true dimensions (but I think there is a deeper misunderstanding at work).

the value of the force at A is easy to calculate ... (a+d+h)/AB*70 lbs if this is 6/1.3*70 = 323 lbs
or it is 230 lbs if a+d+h = 4.27 cm (if AB = 1.3 cm), or h = 1.42 cm.
now by my eye "h" looks to be slightly more than AB, not 50% more, so I question your 2 cm.

but it doesn't matter ! to understand the principle. Draw the truss however you want ...
1) draw AB = 1.3cm, a=d=h=1.42cm, ...
2) draw your own force polygon for node 1. Notice the lengths of these elements are not the same as in figure 8, but their directions are. By eye it looks like fig 9 has length AB rather than "c" from fig 8 to represent 70 lbs; and that's ok (a bit misleading) but he could've used 1 cm the length doesn't matter. what matters in figure 9 is the ratio of the lengths. Then node 2, etc.

Notice that the figures 8 and 9 are different. The length labelled "70 lbs" in figure 9 is not the as the length of member "c" in figure 8.
If you are using "a" etc from figure 9 then your 70 lbs scale length is "70 lbs" in figure 9
(the reason for this is because the lower chord is inclined slightly, so in fig 8 "c" is less than AB).

Now, notice in figure 9 the load in the upper chord is not proportional to the length of the three elements, because the truss is getting slightly deeper.
"h" is not equal to 3*"a"; "d" is not equal to ("a"+"h")/2.
 

Part and Inventory Search

Sponsor