Continue to Site

Eng-Tips is the largest engineering community on the Internet

Intelligent Work Forums for Engineering Professionals

  • Congratulations KootK on being selected by the Eng-Tips community for having the most helpful posts in the forums last week. Way to Go!

stresses in framed structures

chthulu

Student
May 7, 2025
21
Hi,
In the picture that follows, is fig 9 correct?
Using the scale in pounds shown there, the 70LBS line seems to be correct, where line a seems to be more or less 110 lbs and line b seems to be more or less 130 lbs, but using trigonometry I got something else for a and b.
So, is it possible to get a and b through trigonometry?
If you draw the line for the 70lbs according to the scale in pounds, how do you know where to stop when drawing a? or b? if you start from b.
I mean line a could be any length and fig 8 does not indicate how long line a should be.
What would be the best way to add the sketch of fig 8 together?
I really do not understand even how the 180 and 230 lbs are get.
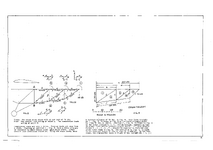
stress diagram.png
 
Replies continue below

Recommended for you

yes, I now realized that the 70 lbs in fig. 9 is not side c of triangle 1 of fig. 8. I assumed that it was, then I realized that side c is drawn as part of triangle 2 in fig. 9. My mistake.
So what side 70 lbs in fig. 9 represents? Line A to B?
 
yes, you are right. Ok so you can not copy and paste those triangles of fig. 8
You are to copy and paste junctions (1), (2), (3), (4), (5) as the directions say to, scaled so the matching vectors are the same size. The paste can be any scale you like, but the 70 pound vector is the basis for scaling all the other forces from the remaining vectors.
 
yes, I now realized that the 70 lbs in fig. 9 is not side c of triangle 1 of fig. 8. I assumed that it was, then I realized that side c is drawn as part of triangle 2 in fig. 9. My mistake.
So what side 70 lbs in fig. 9 represents? Line A to B?
It doesn't represent any side. That is the vector of the force that is applied.
 
"70 lbs" in fig 9 represents the vertical load at 1. It can be any length. The other two forces at one are in known directions, and so you can draw the triangle, and scale the load from the known vertical load.

I feel that drawing fig 9 to look so much like fig 8 is very misleading. If you wanted to relate fig 9 to fig 8 then draw like node 1.
But fig 9 does have a lot of labelling on it, and I think you can figure it out (but who has time for that !?)
 
Yes indeed. I did not pay much attention to fig. 9 by realizing that there is already a side called c and therefore the 70 lbs line could not be side c of fig. 8. At the end the 70 lbs line of fig. 9 has nothing to do with any side of fig. 8, therefore you really need to know the angles.
 
On a drawing one would simply use a parallel transfer to duplicate the slopes, no need to measure the angles, a big advantage of the method. Perhaps they no longer teach how a triangle and a straightedge can be used to do that.

rb1957, it would be difficult for the vector diagram to not resemble the axially loaded member diagram.
 
Superficially it looks similar because it is a regular truss with a point load, but in general there is little obvious similitude between a force diagram and the geometry of a structure. Here's an example

250px-Cremonadiagram.jpg


Unless you know how to construct a force polygon at a joint I don't see how you can expect to draw a Cremona diagram.
 
yes, but drawing "70 lbs" in fig 9 to look like AB in fig 8 (even though it isn't) has caused a lot of confusion. And the scale on fig 9 would be clearer if it used multiples of "70 lbs"

and, yes, this is a quite trivial problem to solve, it was just an example solution that the OP had issues with.
 
The 70 lbs is the basis vector from which all other stress vectors is determined. It has to be where it is and all else exactly attached the way they are.

Were I to try to improve the example I would mark all the features in Figure 9 with a horizontal arrow over each identifier and a note that the arrow indicates the item is a vector. These vectors themselves would have arrows indicating the load into or out of the node. I would have removed the arrows from Figure 8. Finally the joint diagrams would be a separate figure between the first two to indicate the way each works; the nodes should be labeled and not the members.

However, I have no time machine. It's a flaw. My research into graviton diodes has slowed the time travel research and so far the time machine progresses in one direction at 1:1 with local time. Very unsatisfying.
 
Hi,
In the picture that follows, is fig 9 correct?
Using the scale in pounds shown there, the 70LBS line seems to be correct, where line a seems to be more or less 110 lbs and line b seems to be more or less 130 lbs, but using trigonometry I got something else for a and b.
So, is it possible to get a and b through trigonometry?
If you draw the line for the 70lbs according to the scale in pounds, how do you know where to stop when drawing a? or b? if you start from b.
I mean line a could be any length and fig 8 does not indicate how long line a should be.
What would be the best way to add the sketch of fig 8 together?
I really do not understand even how the 180 and 230 lbs are get.
View attachment 9202

Overview of the Image


  • Fig. 8: A truss with loads and force directions shown.
  • Fig. 9: A force (stress) diagram corresponding to the truss.
  • The truss has an external load of 70 lbs at the top right node (point A).
  • Your goal is to find:
    • The tension load at A
    • The compression loads at B


Understanding the Stress Diagram (Fig. 9)


This figure is a graphical method of solving for forces in truss members, based on vector addition using a known force scale.


  • The 70 lb vertical load is drawn downward (line i-j) and sets the scale.
  • Using this, you draw force triangles for each truss joint (especially joints 1, 3, and 5).
  • You then connect these triangles using equilibrium rules (the lines must form closed polygons at each joint).

Here's the critical idea:​


The length of each line in the force diagram (Fig. 9) represents a force magnitude, based on the scale in pounds at the bottom (e.g., 1 inch = 50 lbs, or whatever the scaling is).


Your Questions Answered


Q1: Are the values of 180 lbs and 230 lbs correct?


Yes, assuming the graphical construction is accurate and the scale is used properly, those values are correct according to the vector method. They are:


  • Line b = 180 lbs (compression)
  • Line a = 230 lbs (tension)

These are derived graphically, not analytically, but they should match trigonometric solutions if done precisely.


Q2: Can you get a and b with trigonometry?


Yes! Here's how:


You apply the method of joints and solve using vector resolution:


  • At each joint, sum forces in x and y.
  • Use trigonometry (sine and cosine) to break forces into components.
  • Set up equations and solve.

But to do this, you need:


  • All angles of the truss members
  • Geometry (lengths, heights)
  • External forces

So yes, your trigonometry results are valid, if your inputs are correct. Small differences with the diagram may be due to drawing inaccuracy or scale reading errors.


Q3: If you draw the 70 lb line, how do you know where to stop for a or b?


You don’t know at first. You have to build the force triangle, which will close only when the correct magnitude and direction of a and b are drawn. Here's how:


  1. Draw the 70 lb vertical force (as in i-j).
  2. From point j, draw a line parallel to member a (its direction is known from Fig. 8).
  3. From point i, draw a line parallel to member b.
  4. These two lines must intersect — that closes the triangle.
  5. The lengths of a and b are now known (you can measure them using the scale).


Q4: How do you “add” the sketch of Fig. 8 together?


You use the method of joints. Here's the process:


  1. Start at a joint with known forces (e.g., joint 5 with 70 lb vertical).
  2. Construct the force triangle at that joint (using directions of members from Fig. 8).
  3. Use the scale to get the force magnitudes.
  4. Move to the next joint and repeat.

The lines in Fig. 9 are not arbitrary — they correspond to force directions of members in Fig. 8 and must close to maintain equilibrium.


Summary


  • Yes, trigonometry can be used — it’s the analytical counterpart to the graphical method shown.
  • You stop drawing a or b when the triangle closes, ensuring equilibrium.
  • The values 180 lbs and 230 lbs come from the scale used in the graphical construction in Fig. 9.
  • Fig. 8 defines directions; Fig. 9 defines magnitudes via scale and vector construction.


Part and Inventory Search

Sponsor