I wrote a couple hundred words, but the text disappeared when I submitted. That's the short version.
Here is the rainfall data summary I found.
See if you draw the same conclusion.
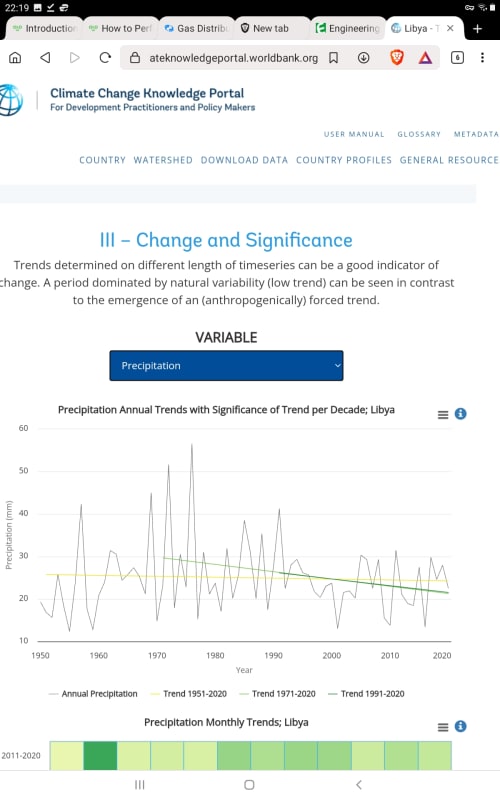
Yearly average is around 25mm, max ever 55mm.
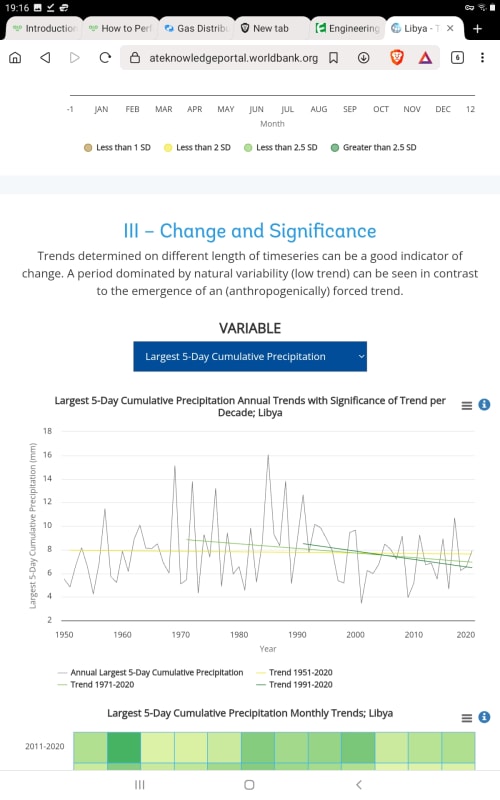
5day rainfall total is available apx 8mm, highest ever 16mm.
10mm on a 157km2 basin at full 100% runoff, not very likely, but still, is 1,57 Mm3.
25mm is apx 4,0 Mm3
100mm is 15.7 Mm3 50% over max ever recorded
yearly rainfall.
Assume the 55mm yr total is 1 in 100yr event, that's the data right there.
55mm 8.63Mm3, worst yearly max ever.
50mm is a 50year yearly rainfall total event, we saw 2 in that range in 100 yrs of records.
40mm is a 20-25yr frequency.
25mm is a yearly frequency.
Those only became apparent during/after the 80's.
In the 50s, those didn't even look possible.
Keep in mind those are
yearly totals. Not convertible to dam capacity, which might, I don't know exactly, only be 25% of those numbers.
55mm, 100 yr total rainfall 8.6Mm3 might represent something like 4 x an actual dam design capacity and they have 2 x that.
1 year totals are very much different than 1 day totals. It's totally unreasonable to expect to get 2 x a worst case year's rainfall in a day, never mind a minimum of 4x that in a few hours.
Yet the dams could hold that much.
I don't really believe the downtrend lines. It's flat. Only the computer thinks it's a downtrend.
2022 and 2023 are missing, so that will only kick it up, not down.
![[pipe]](/data/assets/smilies/pipe.gif "[pipe] [pipe]")