Tek-Tips is the largest IT community on the Internet today!

Members share and learn making Tek-Tips Forums the best source of peer-reviewed technical information on the Internet!

  • Congratulations JStephen on being selected by the Eng-Tips community for having the most helpful posts in the forums last week. Way to Go!

FEA results interpretation 1

Berettapx4

Student
Joined
Jul 22, 2025
Messages
3
Hi everyone,

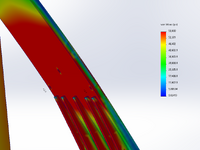
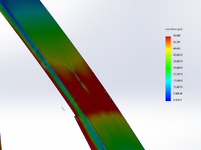
We briefly studied FEA with Solidworks and I am designing something that will be handling a certain load. This is the result I got from running static analysis in FEA. Everything on red would be past tensile strength, If I'm the one interpreting this result, I would say it will fail. But the plate (1 1/2" ASTM A36 plate) are only partially covered with stresses that exceeds the tensile strength. Because bottom and top portion of the plate is red while the middle section of it is experiencing less stress.

My question is, will it break and snap in half or there's a possibility that portion of it will just experience permanent deformation since the plate is not fully under the stress that exceeds tensile strength?
I know there's no accurate answer without testing it in real world but I would love to hear and learn from the people that does FEA frequently.
 

Attachments

  • 1753209138566.png
    1753209138566.png
    133.2 KB · Views: 35
  • 1753209141927.png
    1753209141927.png
    147.9 KB · Views: 35
Um, while playing with cartoon generators is all fun and games, have you actually done any structures classes? do you know how a bending moment is reacted in a beam? If the material is ductile it may bend, permanently, or break, if it is brittle it'll break. Your little riblet things are all failing as well.
 
is your ultimate strength 58ksi ? FEA plots generally are scaled to the maximum result, not necessarily the strength of the material.

be very careful with FEA, it is very easy to get beguiled.
 
Please refer to the "bending" section of your mechanics of materials textbook. The top and bottom surfaces are displaying higher stresses due to their distance from the neutral axis. Simple analyses such as this one can and should be approximated by hand before verifying with FEA.

I would also avoid using the ultimate strength for the contour scale, even more so with linear static solutions...
 
What does your hand calculation say should happen? Does your model at least generally match your hand calc? If you don't have a hand calculation to verify your model, fix that before you do any more FEA.

Also, assuming your model is at least vaguely correct, it's predicting that significant portions of this thing will experience stresses beyond yield, so unless your model is specifically set up to accurately handle plasticity, the results aren't very accurate anyways.

Finally, what is your failure criteria? Are you ok with large scale plasticity or are you trying to keep most things elastic with a nice factor of safety against yielding in all but the smallest areas?
 
I was not suggesting changing the legend so that it'd account for ftu, though I see no reason not to do this; I was thinking that the OP was looking at the plot and thought "red = broken" but red only means stress in the highest band. By default the legend picks the highest stress in the model and sets up the bands with this in mind (though it can be set up based on ftu).
 
is your ultimate strength 58ksi ? FEA plots generally are scaled to the maximum result, not necessarily the strength of the material.

be very careful with FEA, it is very easy to get beguiled.
Usually I use the yield strength of the material but for this one, we are trying to find the breaking load and how it's going to break that's why I used the UTS. Is it the right way to do it? I have no idea. I just know that beyond UTS, it's not safe and failure is alongside with it that's why I thought, maybe I should use that for the plot and assume whatever is red will fail.

In school we only used 11 GA steel specimen on the materials lab and it did snap in half after necking and that was the only experience I have with materials breaking. I've seen metal bent or cracked but not snapped in half especially the different type of metal like tubing, thick steel plate and more. . I'm still learning honestly that's why it is nice to see replies from you guys that has a lot more experiences in the field.
 
What does your hand calculation say should happen? Does your model at least generally match your hand calc? If you don't have a hand calculation to verify your model, fix that before you do any more FEA.

Also, assuming your model is at least vaguely correct, it's predicting that significant portions of this thing will experience stresses beyond yield, so unless your model is specifically set up to accurately handle plasticity, the results aren't very accurate anyways.

Finally, what is your failure criteria? Are you ok with large scale plasticity or are you trying to keep most things elastic with a nice factor of safety against yielding in all but the smallest areas?
Yup you are correct, I haven't done any. I'm not blaming my professor nor my university since it's my responsibility to do that at first. But I remember the way we do it is by just finding the force applied on it and do the FEA especially if the part is not critical where it could kill anyone. I remember my prof saying "Your employer won't be thrilled if you spent your whole day doing calculation for a hose bracket." haha

That's great input and I have to remove that bad habit honestly.

Yes, my goal here is to see if my piece would snap in half or bent/fold. Just trying to see if this piece would still be attached after certain load or will be in many pieces. The thing that throws me off is the blue/green section where it says that the middle part of the plate is still fine but the other parts are not. But either way it's great to hear anything from someone who has more experiences with this so Thank you.
 
I am commenting out of memory but I think A36 has an ultimate tensile of 58,000 which is the high end of your vertical scale. I am not familiar with your software but to me, the depth of red in your component is much darker than the scale at 58,000. I would want to know why from a software output perspective. As rb1957 pointed out, make sure you know how that scale got created. Did the software hone in on 58,000 because it was A36 material, or does your structure just happen to be stressed at 58,000? Change to a material with a higher Fu, and see what it does to your scale numbers for curiosity.

Since Von Mise is doing some mathematical gymnastics with direct tension and shear, then comparing to direct tension (I think that is what it does), it is somewhat accounting for shear affecting direct tension strength. But what happens when a portion fails, I think is the same as when it fails in most senses. The failure generally first occurs at what my age group used to call "the extreme fiber". If I have Area and Section Modulus that both rely on the thickness for their magnitudes, failure at the extreme fiber can be viewed as now having less Area and Section Modulus. If the max Area and Sx could not resist snapping at the extreme fiber, how can having less of them not snap itself at the "new" extreme fiber. So, when the outside edge goes, it all goes.

As far as making judgements about what the output may mean. Output from a program is just one thing, numbers. It says, you give me this, I crank some numbers and give you that. You know what FOS you are wanting and other parameters that determine failure. Define failure better. Is failure breaking or exceeding some value that includes a FOS? In some final designs, failure is bending too far.

As far as what "Red" means, rb1957 makes a good point, red color is whatever someone chose to make it in their scale. Red could have been the lowest stress and Blue the highest. Even with Red being on the high end, it is not Red is bad, it is Red is the highest. I recently did a lot of work related to hurricane damage. I have seen several 'Water Restoration" companies show up with a Thermal Imaging "pistol". It measures temperature and the output is an image with a scale similar to yours. They show the owner the areas with "blue" and claim that is water intrusion and the people believe them because Blue is the color most associate with water. Blue is some temperature range on the gun. Good con though. Get paid to dry out something that is not wet.
 
Ditto all the comments about doing a hand analysis first.

Linear static FEA can be used to check that the stresses and deflections are not excessive for your design load, but that is not necessarily the same as predicting failure. Failure tends to be nonlinear: either the material exceeds the yield strength or the deflections become large (linear FEA means linear elastic material AND small deflections). Any time the stresses exceed the yield strength over a substantial area (say more than just locally around a hole) indicates that the FEA results are no longer valid - you have violated the assumptions of the tool. After the yield strength is exceeded, the stresses will redistribute and the linear analysis is not accounting for that.

That does not necessarily mean that you have to do an advanced nonlinear FEA though. There are ways to handle nonlinear problems with hand analysis if that were to become necessary for your application (see references on Plastic Bending).

In your case, it looks like very large regions have exceeded 36 ksi (all the red, yellow, and some of the green areas), so that looks bad to me. You also need to consider factors of safety and such things (maybe you factored your applied loads?), so it is possible that your "allowable" stress might have to be lower than the materials Yield Strength (or Ultimate Strength). It depends on your application and/or industry requirements.

By the way, although I said "yield strength" that more accurate term to consider for material nonlinearity should be the "proportional limit". The proportional limit may be close to the yield strength for some materials, but it may be much lower (~60-70% of the yield strength) for some materials. For a good understanding, you really need to know what the stress-strain diagram looks like (its shape), not just a few numbers from a table.
 
the real problem INHO with von mises is that it hides what is compression and what is tension (why does the pic show red on both sides, when in bending ? oh, yes, von mises stress. plot max and min normal stress. If you have set up your stress scale to Ftu, then include on the plot the maximum value (this should be an option), if not plot with auto-levels and this'll show you the maximum value. I assume you're doing this for your own education ? I'd work through a text, with problems and solutions.
 

Part and Inventory Search

Sponsor

Back
Top