Follow along with the video below to see how to install our site as a web app on your home screen.
Note: This feature may not be available in some browsers.
Hi friends,
Why does the allowable stress for material 1.0345 in the Caesar II program appear to be greater at 200,000 hours of operation than at 100,000 hours of operation?
View attachment 14631
I got the values from caesar ii database (as seen below), actually in EN 13480 standard, it is said to take 1.5 safety factor for 100,000 working hours and 1.25 for 200,000 working hours, but this condition is an absurd result according to me because a higher allowable stress value is seem as a reference in the case of 200,000 hours of operation.What is the source of your values? What is happening the the test samples for 100,000 and 200,000 hours?
If the EN standard requires a safety factor, I would hope the published data is with those safety factors applied? Or it otherwise says this is the raw data.
Is there a spelling error in the safety factor table? The hours listed don't line up with the material hours given. I would expect it to say SF for 10,000 hrs, following by 100k, 200k, 250k hrs based on that material table.
This is a time-dependent design calculation, not a cycle, but a system that will work continuously, for a life of 20 years, 200,000 hours, I am looking for the allowable stress of the material can according to the EN standard due to the creep event.I agree with RVAmeche that it is important to understand if the table values do, or do not, have the safety factor already applied.
It is also important to be clear on the assumptions for the data. What is actually happening over 100k or 200k hours? Is there a cycle assumed for temperatures and/or stresses, or is this a steady-state temperature creep situation?
The table data is going to be very specific, compiled from detailed experience, where the safety factors are more general and rounded from a greater body of data. This could produce small apparent anomalies. That being said, the apparent discontinuity of the 480C and 490C points in the 200K curve are puzzling and cause for questioning. I would first check that you typed the data correctly into Excel. I would also chart the table values directly without any modification. You could then check that the Caesar values are in 100% agreement with the EN values. Then you could inquire with the EN governing body about a possible error.
I actually I need this information if you can help me thank you very muchIf you have questions/concerns about the EN standard data I would try to contact a fabricator or someone who can tell you what their piping material properties are.
I understand I will contact the manufacturer as you said, thank you for the discussionI meant if you know who's buying/sourcing the material, ask them for detailed material property information (assuming new construction). That's not commonly something my company gets involved with so I don't have any leads for that.
This is weird. Normally, allowable rupture stress lines parallel with the highest allowable stress for the least design life, with decreasing stress value with increasing design life. Table A.1 looks to be correct.I got the values from caesar ii database (as seen below), actually in EN 13480 standard, it is said to take 1.5 safety factor for 100,000 working hours and 1.25 for 200,000 working hours, but this condition is an absurd result according to me because a higher allowable stress value is seem as a reference in the case of 200,000 hours of operation.
View attachment 14673View attachment 14674
View attachment 14675View attachment 14676
Best Regards
Bahri Elman
Piping Stress Engineer
Couple of questions for you:This is a time-dependent design calculation, not a cycle, but a system that will work continuously, for a life of 20 years, 200,000 hours, I am looking for the allowable stress of the material can according to the EN standard due to the creep event.
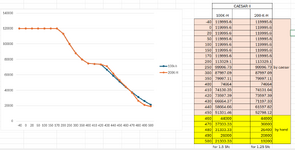
Actually, as you said, I compared the data via Excel, you can see it in the image below. Still, the same inconsistency occurs. I couldn't find the source of the inconsistency here, but we can be sure that the data is correct.
The allowable stress values that I marked in yellow are the data I calculated according to the EN standard, and the others are data taken from the database of the Caesar II program. But I only made calculations for temperatures above 450C because the allowable stress values of this material do not appear in the Caesar program for temperatures above 450C.
View attachment 14693
1- Design temperature is 460CCouple of questions for you:
1. What's the design temperature for the service?
2. Did you pass/check Notes (c) and (d) in table 5.3.2-1 in order to apply the safety factors?
3. What rule did you apply to extrapolate the values in yellow - Equation 5.3.2-1?
4. Have you thought about why Caesar limits the stress values only upto 450C?
5. Do you want to say that there is no limit to the service temperature for the material because you have an equation given by EN 13480-3?
This is weird. Normally, allowable rupture stress lines parallel with the highest allowable stress for the least design life, with decreasing stress value with increasing design life. Table A.1 looks to be correct.
Yes, table A.1 looka to be correct, but the design life safety factors cause inconsistencyThis is weird. Normally, allowable rupture stress lines parallel with the highest allowable stress for the least design life, with decreasing stress value with increasing design life. Table A.1 looks to be correct.
OP,1- Design temperature is 460C
2- Yes I appyl 1.5 for 100,000hour, 1.25 for 200,000hour
3-I took the values in table a.1 and divided them according to the safety factors in table 5.3.2.1.
4-I think Caesar ii leaves it up to the user to define the allowable stress values depending on whether the creep is under surveillance or not.
5-No, I am just trying to find the permissible stress values of the EN code in response to the strength values of the material, but the code allows lower stress in the case of 100,000 hours of operation according to the safety coefficient it gives. I wonder what the source of the contradiction here could be.