Isabelle...
Every problem, whether in school or at work, is easier to solve when broken down into small, easy to handle parts, and many problems are easier to understand after drawing a diagram or two. This problem is no different. I suspect you don't know where to start because this is a word problem with multiple steps that you need to develop, rather than just an equation to solve.
I suggest starting with this approach:
[ul]
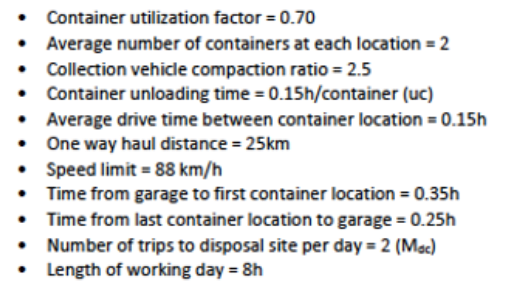
[li]Separate the data into categories and pay attention to the units. For example, what does your second sentence, the first three bullets, and (later) some simple arithmetic tell you?[/li]
[li]Figure out if there is any unnecessary data. Some professors like to do this to trip up students. This is not a bad thing, actually. (BTW, both my EIT (1979) and PE (1983) exams included a couple problems with unnecessary data.)[/li]
[li]Figure out if there is any missing data that may require you to make reasonable assumptions. For example, is the speed limit the average speed for those legs of the day's travel? I doubt it, but then what would the estimated average speed be? If you make such an estimate, be sure to explain it in your calculations. (BTW, my PE exam was 8 problems in 8 hours, show your work. Every problem required me to make and justify at least one assumption, such as pipe roughness coefficient, concrete and rebar strengths, etc.)[/li]
[li]You know what the required answer is (truck capacity), but you can also help the solution process by figuring out what numbers you need that go into the final answer and maybe even the numbers that go into the step before. That is, sometimes you need to look at a problem both forwards and backwards to develop the steps in the algorithm that will produce the desired result. Also pay attention to what numbers must be integers, which might require a round-off at the appropriate time to produce an integer. Fortunately, this problem requires only simple arithmetic and simple algebra (i.e. no hyperbolic trig functions, complex numbers, or partial differentials).[/li]
[li]Draw a diagram of the day's events, path of travel, and times, and label each part with the data you know. Figure out when during day the truck goes to the disposal site (Hint, it's probably not first thing in the morning
")
). This diagram will have one or more unknowns when you first draw it, so make a representation of the unknown(s) for schematic purposes and note what the unknown(s) is/are. After you have solved the problem, I suggest redrawing the diagram with the unknowns resolved, then recheck your answer.[/li]
[/ul]
Word problems trip up most people, including many engineers. However, in the working world, most of our problems start as word problems. Many/most of these problems have insufficient or invalid* data and other "inconveniences." Our job as professionals is to take what we know, what we can reasonably assume, and apply our training and experience to come up with a solution that won't get us sued. :-(
*About 15 years ago I was the Engineer of Record for the site civil design for a new mental health building at an existing California state prison. One of our tasks was to evaluate the existing on-site utilities (water distribution, sewage collection, storm drainage collection, natural gas distribution, and electrical distribution) for capacity and (where possible) physical condition. The quality of the data (e.g. water and natural gas demands, pipe sizes, electrical demands, wire gauges, etc.) varied quite a bit and some data was simply missing. The best data was for the water system and the worst data was for the natural gas system. For natural gas, I was provided with five years worth of monthly meter readings and billing records from Pacific Gas & Electric Co. and daily meter readings made by site staff. The problem was that the daily readings totaled to more than three times the PG&E monthly readings and neither one was close to the predicted values based on the capacities of onsite gas-fired equipment and gas usage at other state prisons (the predicted values were about half-way between the two data sets). The daily readings followed the correct weekly pattern (lower usage on the weekends and holidays because the laundry was not used on those days), but the totals didn't make sense and neither did PG&E's totals. The site had commissioned a leakage test within the previous year, so leakage did not appear to the reason the daily readings were so high. I ran some flow/pressure calculations based on the three different sets of data (PG&E, predicted averages, and staff) and asked site staff to get me some pressure gauge readings so I could take a stab as resolving this difficulty, but I never got them. In the end, my evaluation boiled down: your data is funky, all your equipment seems to be operating just fine (i.e. no known pressure or flow problems), and some of your pipes are old Aldyl-A, which is prone to cracking and should be physically inspected ASAP by an expert in this type of pipe. Real engineering is often this "messy." But that's also part of what makes it fun.
Fred
============
"Is it the only lesson of history that mankind is unteachable?"
--Winston S. Churchill