I have measured the pressure between the head and the helmet that arises when wearing a helmet, using pressure sensitive film. The purpose is to see how the pressure is distributed around the head. The film was applied to the head like a sweatband and is divided into a number of sensors that measures the pressure in real time. I have the values stored in an excel document and now I am thinking of ways to have them easily presentable. The sensors are numbered from 0-30 around the head with each sensor having a value in excell. something like this:
# KPa
0 5
1 4
2 10
3 10
.
.
.
29 3
30 8
Is there a way in Excel or some other program that lets you visualize in the following way where the length of the arrows represents the value at that point:
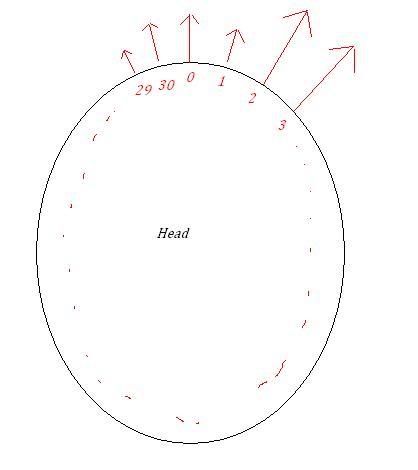
# KPa
0 5
1 4
2 10
3 10
.
.
.
29 3
30 8
Is there a way in Excel or some other program that lets you visualize in the following way where the length of the arrows represents the value at that point:
 lease see FAQ731-376 for tips on how to make the best use of Eng-Tips.