Gtpplot reads the .cfg file and uses timemul
I your example, timemul is
0.477225214242935
It is in micro seconds
The .dat contains:
1,0,267801390,1676682854,-1947471288,84259708,482838889,-574376845
2,349,401917008,1593459685,-1998414489,111587178,464445025,-587236013
3,698,530874354,1505109808,-2041665140,138914648,446051160,-600095212
4,1048,661035311,1415050998,-2084060886,170796696,423058847,-604381591
--------
With this, the time for first point is zero
The second point time is 0.477225214242935*349= 166.5515998 us
It is not a integer submultiple of the period = 1/60 = 16666.6666666 us
The third point time is 0.477225214242935*698= 333.1031995 us
It is not a integer submultiple of two periods = 2/60 = 33333.33333 us
and so.
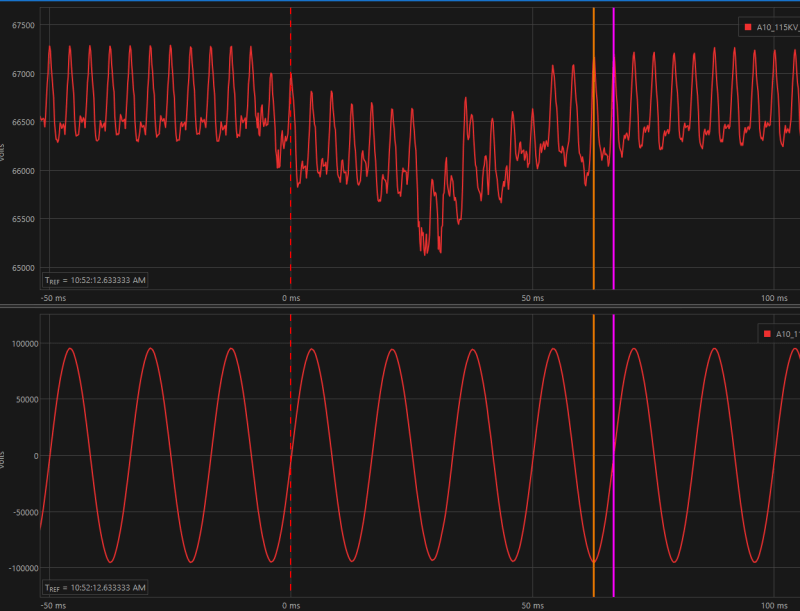
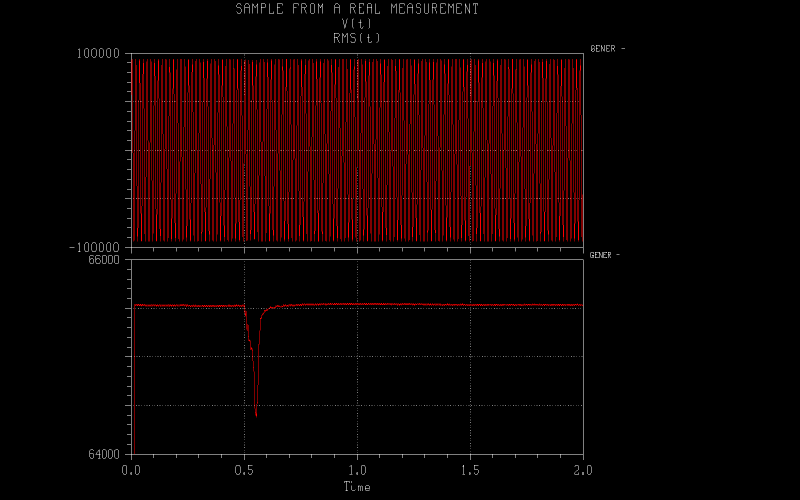
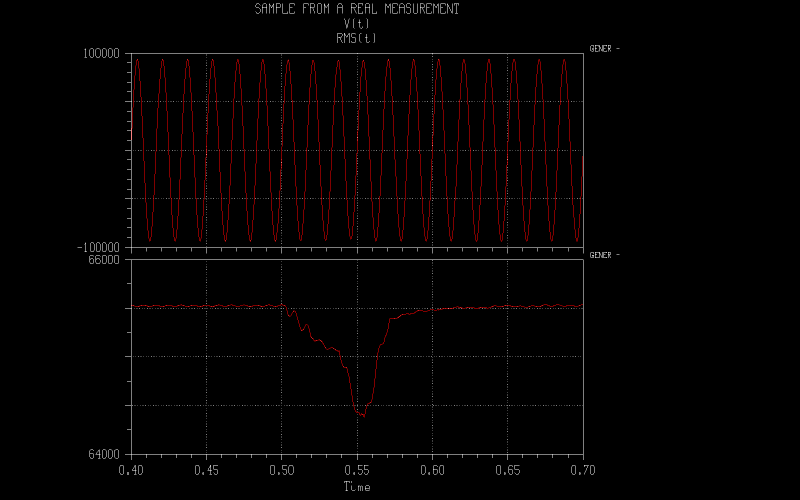
The RMS are calculated by any procedure by summing the V**2 and at
the end of each period the sqrt(sum) is divided by the period.
The true period is 1/60 = 16666.6666... s, but the numerical (data)
period is too short or too large.
6000 samples/second at 60 Hz are equivalent to 100 samples per cycle
At 100 samples per cycle
98,33876,-148644860,1899181215,-1758741514,11386454,519626618,-535799278
99,34226,-9886764,1829970919,-1826779984,38713924,510429685,-557231266
100,34575,128527446,1757684526,-1889860854,61486816,492035821,-561517645
101,34924,264362521,1678733644,-1946274669,93368864,478240440,-570090435
The true zero is not at the sample #100, T= 16500 us
#101, T= 16666.6 us
It is a problem due to 60 Hz, I guess. 100 samples/s at 50 Hz have better behavior.
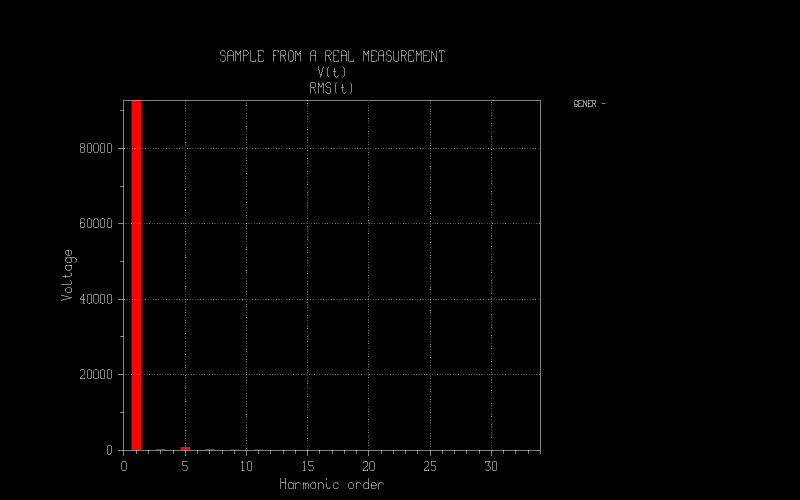
It is seen as non multiples harmonics, and distorted RMS.
May be a floating point COMTRADE file helps, the true time and
variables value are in 32 bits (REAL*4) Fortran numbers.
The integer times are too coarse, I guess.
I am not expert in COMTRADE, my interest is in to open a COMTRADE
file to plot as any EMTP-ATP graphics files.