electricpete said:
I'm holding any questions to avoid hijacking op's thread.
.
Ahhh... the heck with it!
Greg said:
Question for the panel
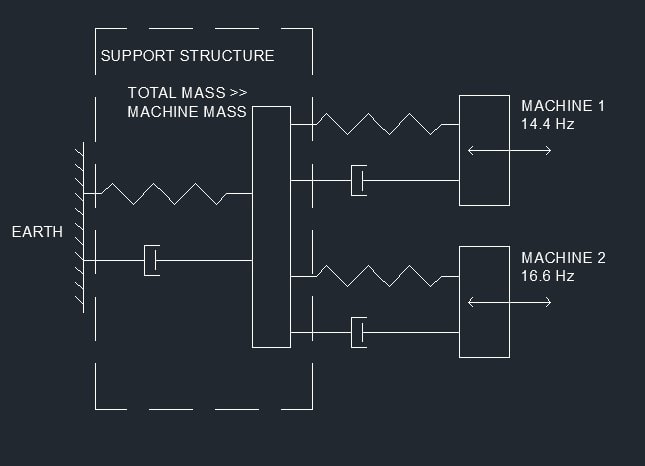
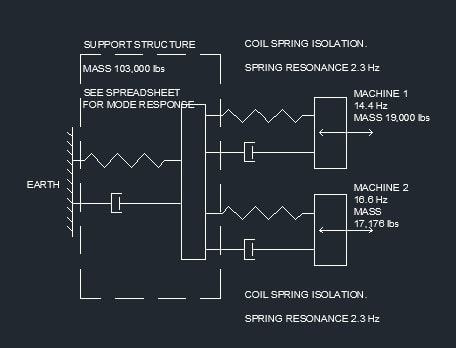
consider a single degree of freedom spring/mass/damper system
Tune it to 2.2 Hz
Apply the 14.4 and 16.6 Hz, forces, simultaneously.
What frequency(s) will it vibrate at?
Now run it at 14.4 and 15.5, or 14.4 and 17.7
Is the amplitude greater or smaller?
My guess is that the 15.5 case will give the biggest maximum displacement, simply because we have a lower frequency input into a low pass filter. The 2.2 is not a real physical excitation in some fundamental fashion.
I'd like to revisit that question and try to understand your results.
My logic agrees with what you said in that post above. We have a linear system model. We can predict the responses to each of the sinusoidal inputs. The total response waveform is the sum of the individual response waveforms.
Now one question is how do we characterize that sum waveform in terms of a magnitude. There are two common options:
[ul]
[li]1 - RMS. The RMS of the total response should be the sqrt of the sum of the squares of the RMS of the individual responses. But we can't judge that from the waveform, so it's not worth further discussion. [/li]
[li]2 - True peak.
ASSUMING (assumption 1) that the frequencies are not related by a ratio of integers, then we know that the "phase" relationship between the two peaks (maybe strictly speaking I can't call it phase, we can also call it the time between the positive peak of the two sinusoids) will drift somewhat randomly between 0 and half the period of the higher frequency sinusoid. Therefore
ASSUMING (assumption 2) we examine the waveform over a sufficiently long period of time, then they will eventually line up so that their peaks are at/near the worst case combination (which gives the peak of the sum as the sum of the peaks) at some point during that long simulation.[/li]
[/ul]
That's how I think it should work. So
ASSUMING (assumption 3) that indeed the 15.5 has a lower individual response than the 16.6 and 17.7, then I'd expect the peak of the combined waveform would be highest when we combine 14.4 with 15.5 (rather than combining it with 16.6 or 17.7)
But that is not what we see on your graphs. The system including 16.6 input gives the highest combined peak. So in my mind, among the three assumptions identified / bolded above, one of them
must be wrong:
[ul]
[li]Assumption 1? Sure we violated the "ratio of integers" assumption (since our frequencies are not irrational numbers), but those integer ratios are high enough that
I doubt that is the problem[/li]
[li]Assumption 2? The simulation looks like it has run long enough so that the peaks have stabilized and we are close to the true peak so
I doubt that is the problem.[/li]
[li]Assumption 3? This has my vote for the assumption that was violated. Mabye the individual response of 15.5 is not lower than the individual response to 16.6 and 17.7 for the particular system and output that your are plotting. I have to immediately followup by admitting that I don't understand exactly what your system looks like and what is the output that you are plotting.[/li]
[/ul]
That's the way I see it, maybe I'm completely missing something somewhere.
Another unmistakeable feature of the graphs as mentioned before is the envelope of the input shows up in the response much better in the combination with 16.6 (where the envelope frequency matches a resonant frequency). I have no idea why that would be.
=====================================
(2B)+(2B)' ?