Returning to the original topic:
I have added an Excel front end to the Python section properties program linked by Celt83:
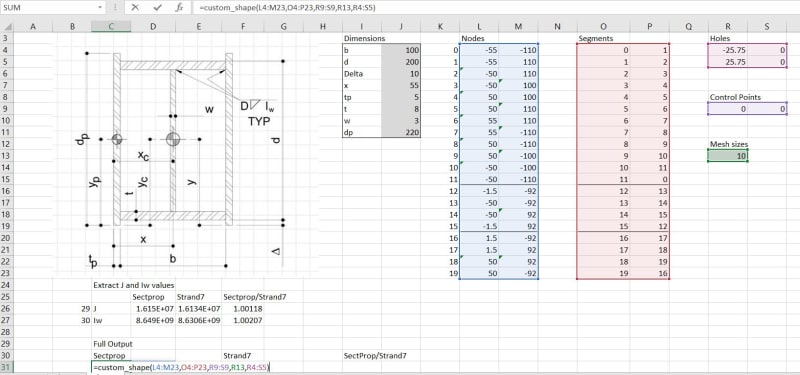
I have compared the results with output from the Strand7 FEA package and found close agreement.
The spreadsheet and python file are attached. Note that:
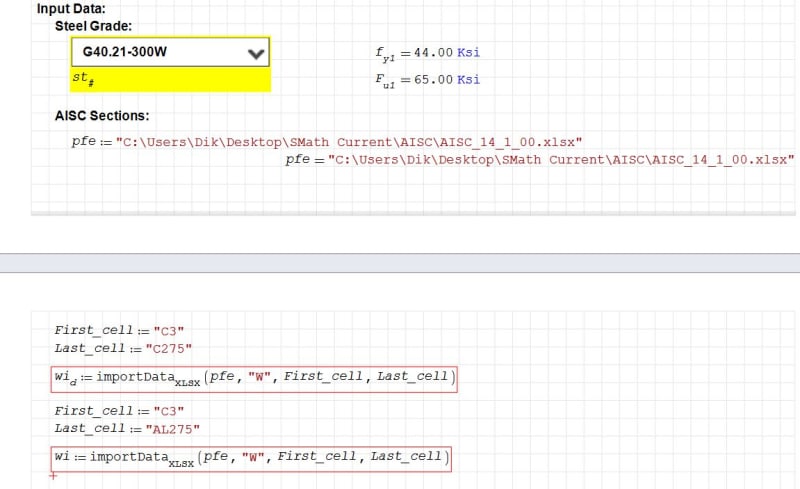
1. The spreadsheet requires the Python SectionProperties (+ meshpy, numpy, etc) to be installed and also pyxll (which is a commercial program)
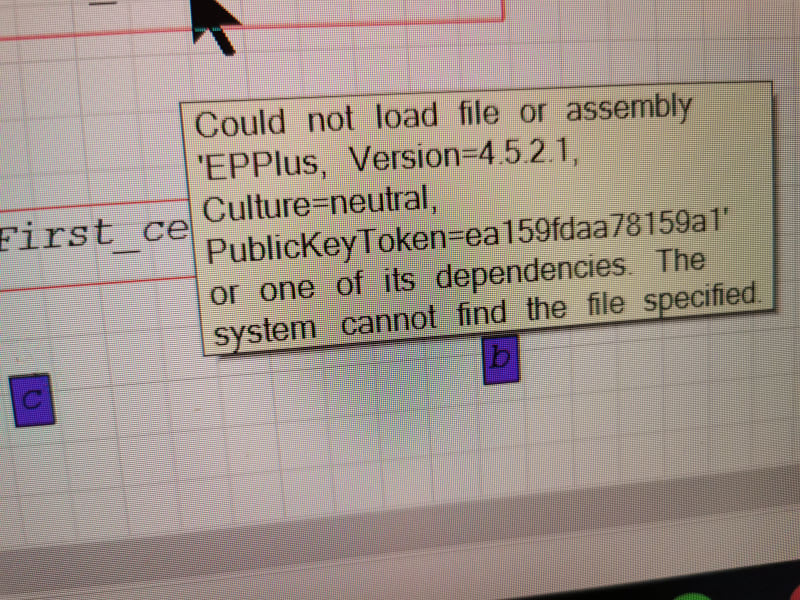
2. The SectionProperties installation via pip didn't work for me (in Windows), but I found if I copied the sectionproperties folder into my active pyxll code folder, the code worked, other than plotting.
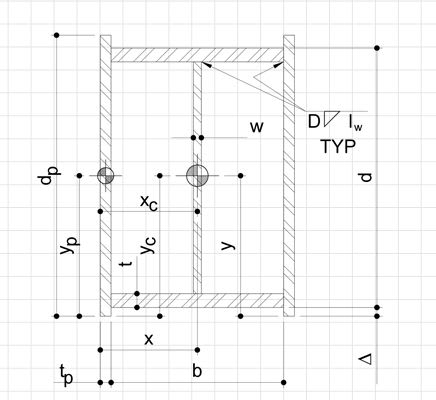
3. I haven't been able to get the plotting routines to work with Excel, in fact they usually cause a crash, so all calls to plot routines in the example functions have been commented out. The custom_shape function will however return all 64 section property values as a dynamic array.
Doug Jenkins
Interactive Design Services
![[ponder]](/data/assets/smilies/ponder.gif "[ponder] [ponder]")