HansonBoye
Mechanical
Hi,
Im new to FEA..im trying to do a stress linearization for a pressure vessel body using solidworks simulation.
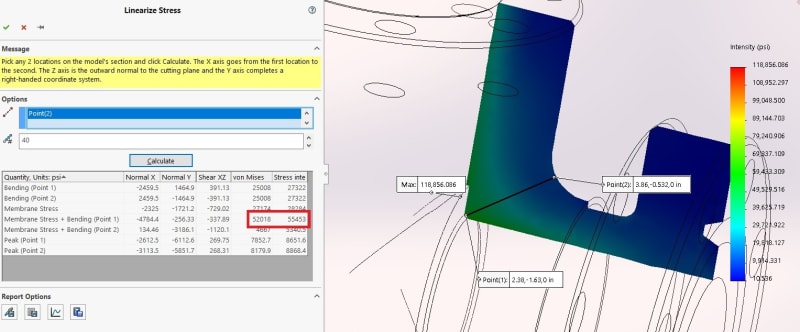
As you can see in the picture attached pic 1 shows the stress points and calculated membrane + bending stress between these two points. Which is around
50000 psi for von mises and stress intensity.
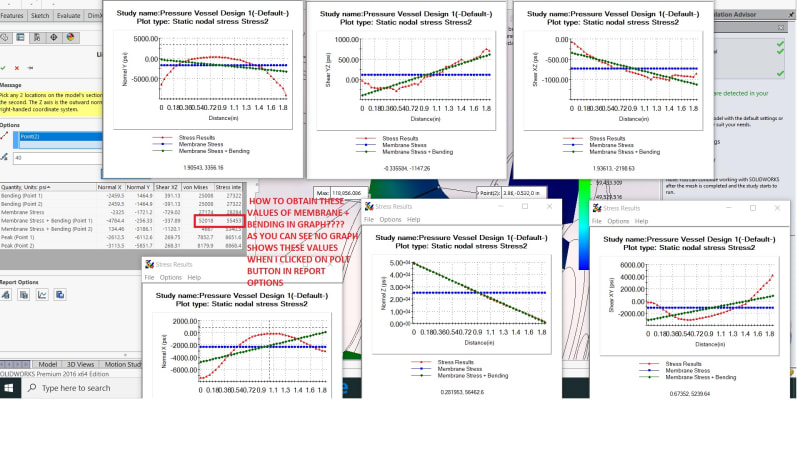
But when i try to plot using the plot button under the Report Options section below... the graph doesn't show up these values (See pic 2)
how to get these values on the graph or may be im interpreting it wrongly. Can anybody help how to get the values right on graph plot.. is there any options that i need to change? Thank you very much in advance.
pic 1:
pic 2:
Thanks,
Hanson
Im new to FEA..im trying to do a stress linearization for a pressure vessel body using solidworks simulation.
As you can see in the picture attached pic 1 shows the stress points and calculated membrane + bending stress between these two points. Which is around
50000 psi for von mises and stress intensity.
But when i try to plot using the plot button under the Report Options section below... the graph doesn't show up these values (See pic 2)
how to get these values on the graph or may be im interpreting it wrongly. Can anybody help how to get the values right on graph plot.. is there any options that i need to change? Thank you very much in advance.
pic 1:
pic 2:
Thanks,
Hanson