Hi all,
I have a simple quesiton on the pressure distribution over an aerofoil but I can't seem to conceptually visualise it.
I am starting to convince myself of the flow over a circle such as the image below:

The stagnation point is a region of obvious high pressure (Cp = 1.0) and zero velocity, as the flow moves upwards this is a movement from high -> low pressure (dp/dx < 0) and so is favourable, this translates to an increase in the fluid velocity. At the top of the circle the maximum velocity/lowest pressure is achieved. From the rear of the circle there is also a wake region/seperation region resulting in low pressure.
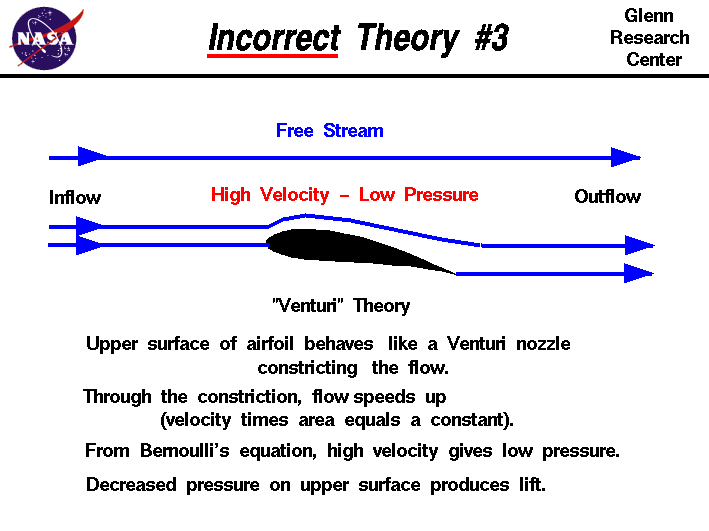
My question is why does the boundary layer seperate on the right but not the left, i.e why does a downward curve translate to an adverse pressure gradient, from NASA's website:
you cannot think of it as a simple venturi for the bulk flow with the freestream acting as a theoretical wall (although this would make it easier to understand).
Thanks for any info,
Hob
I have a simple quesiton on the pressure distribution over an aerofoil but I can't seem to conceptually visualise it.
I am starting to convince myself of the flow over a circle such as the image below:

The stagnation point is a region of obvious high pressure (Cp = 1.0) and zero velocity, as the flow moves upwards this is a movement from high -> low pressure (dp/dx < 0) and so is favourable, this translates to an increase in the fluid velocity. At the top of the circle the maximum velocity/lowest pressure is achieved. From the rear of the circle there is also a wake region/seperation region resulting in low pressure.
My question is why does the boundary layer seperate on the right but not the left, i.e why does a downward curve translate to an adverse pressure gradient, from NASA's website:
you cannot think of it as a simple venturi for the bulk flow with the freestream acting as a theoretical wall (although this would make it easier to understand).
Thanks for any info,
Hob


