Ulysses Soto
Materials
Hello,
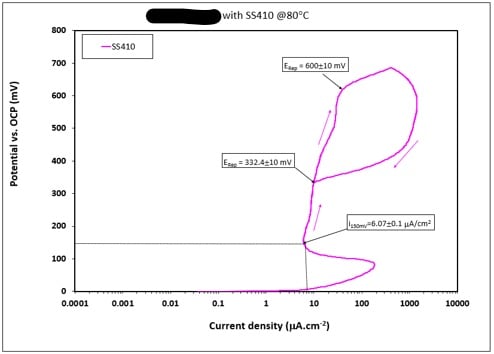
Details: I've recently been learning how to run cyclic polarization and critical pitting against our companies chemicals using methods ASTM G-61 and ASTM G-150. We currently have a Gamry branded set up i.e. potentiostats, electrodes, cells.
I've been extracting the raw data from Gamry and graphing it on excel to create the graphs seen below.
Question: Is there a better program out there to create these graphs? My current method seems inefficient.
Any help on this would be appreciated.
-Ulysses