Tek-Tips is the largest IT community on the Internet today!

Members share and learn making Tek-Tips Forums the best source of peer-reviewed technical information on the Internet!

  • Congratulations cowski on being selected by the Eng-Tips community for having the most helpful posts in the forums last week. Way to Go!

Natural frequency analysis

Status
Not open for further replies.

Samviens95

Aerospace
Joined
Nov 17, 2020
Messages
8
Location
CA
Hi,

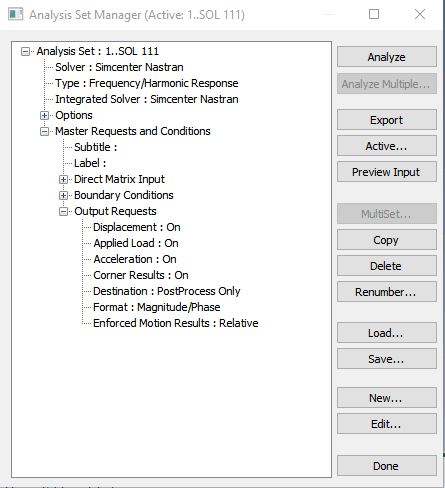
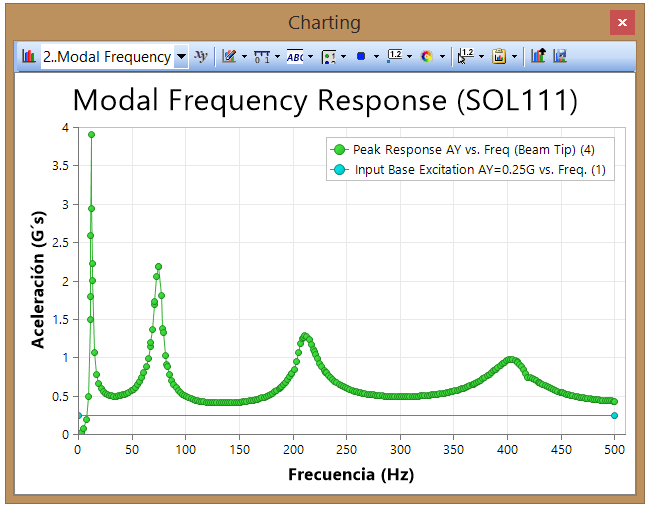
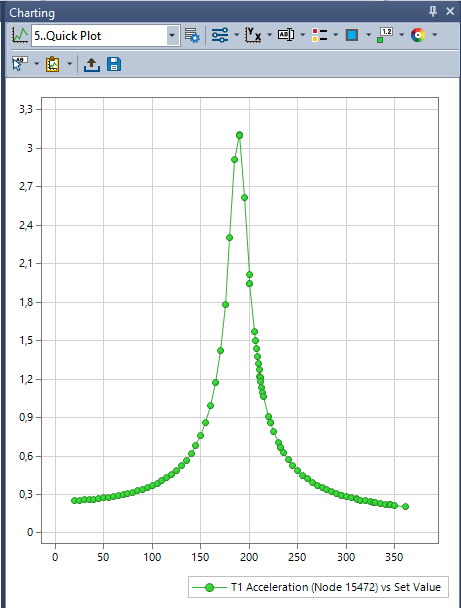
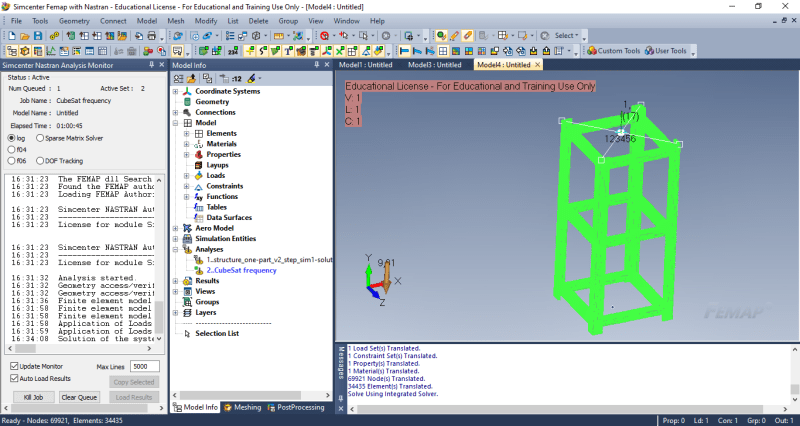
I got my natural frequencies from Siemens NX and went in FEMAP to obtain the plot of my peaks at those frequencies. The problem is that I am new to this and I don't know how to get a good plot. I watched a lot of tutorial but nothing is working. Here's a description of my analysis:

- A CubeSat fixed on one end (4 tips)
- Frequency range: 20 to 2000 Hz
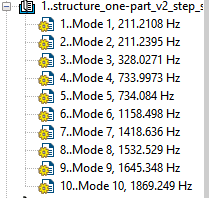
- First natural freqeuncy: 211.218 Hz

Note: I am only analysing the structure with no added mass

FEMAP_Analysis_ajc3bd.png
 
what output have you asked for ? frequencies and displaced shape (ie nodal displacements) ??

another day in paradise, or is paradise one day closer ?
 
I ask for the displacement in output request from «Manage» of the study. And in my plot I asked for T2 translation since my excitation is in this axis.
 
yes, but did you ask NASTRAN to output these values ? (so FeMap can display them)

another day in paradise, or is paradise one day closer ?
 
I am not sure what you are asking. Where do I have to ask NASTRAN to do it? Because I am using FEMAP for my study. Is it in the Manage window that we ask this?

Thanks
 
FeMap is only the front and back end of the FEA (the pre-and post-processor). NASTRAN is the FE engine under the hood; when you select model\analysis.

another day in paradise, or is paradise one day closer ?
 
Here is a screenshot of the analysis output request:

analysis_ej31tp.png


analysis2_pq9eul.png
 
This is the kind of plot I am looking for:

Plot_I_want_xnxiaw.png
 
so you see you are using NASTRAN ... "Simcenter Nastran"

you have asked for displacement at each node, but can't plot the deformed shape ?

another day in paradise, or is paradise one day closer ?
 
When I but my excitation of 0.25G in the Y axis I get this for the accelaration vs frequencies:
AY_zhxw2x.png


When I put the excitation in the X axis I get this for acceleration and displacement:
Ax_oz93cu.png

T1_xlctxb.png


The peak is at a frequency of 190 Hz instead of 211 Hz as I was expecting with the X excitation and I dont understand why it doesn't start at 0 displacement?
 
I think I have something better now. I did my 3 axis back to back on the complete frequency range and it gives me this:

My natural frequencies are suppose to be:

Natural_freq_e1t5jt.png


Does it make sens or not at all?

By the way thanks for your answers rb1957
 
when you say "are supposed to be" ... is this school work ?
or are you rerunning someone else's model ?

this thing is 350mm tall ?

your tables are confusing to me ... is ordinate "350" the top or the bottom of the model ? (the restrained end or the unrestrained end)

Not sure why none of your results look like the plot you want (17:19 on the 18th Nov, showing the maximum response of a input (ay = 0.25g) ?


another day in paradise, or is paradise one day closer ?
 
In fact I use the same excitation of 0.25G, but the graph I sent at 17:19 on the 18th Nov was an example I followed. My dimensions are:
(100 x 100 x 200) mm
I fixed one end and put my excitation at the same end. I look at 1 node at the other end. In my graphs, x axis is the frequency and y axis is the acceleration. My frequency range is 20 to 2000 Hz. In my last post I put a word file if you didn't see it. But I got somethnigs to change still.
 
when you "fix one end" ... is that constraining 6 dof at a bunch of nodes ? That may not be correct. You should model exactly as your example. Maybe they said "fixed" but maybe they constrained 3 dof (translation) at each node. Even this is not "good" practice ... the constraint should avoid infinite stiffnesses.

another day in paradise, or is paradise one day closer ?
 
Hello!,
Take a look to this post and you will learn how to perform a modal frequency response dynamic analysis (SOL111) using FEMAP & Simcenter Nastran:

BRACKET-SETUP-ANIMATED_sruchx.gif


Best regards,
Blas.

~~~~~~~~~~~~~~~~~~~~~~
Blas Molero Hidalgo
Ingeniero Industrial
Director

IBERISA
48004 BILBAO (SPAIN)
WEB: Blog de FEMAP & NX Nastran:
 
Status
Not open for further replies.

Part and Inventory Search

Sponsor

Back
Top