You can Email me if you need to- I'll post a link if you ask for it without hesitation.
With that said I am blown away by your response being so detailed and in depth. I would give you another Gold star, but, I am limited to one start per member per thread.
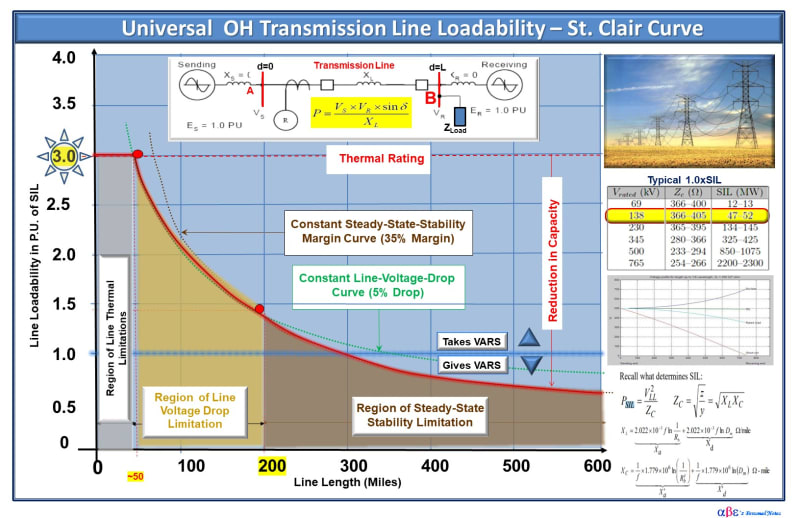
c) Why SIL is one of the dominate factors? To evaluate transmission line performance, conductor rating ampacity is not enough. For example, a better indicator of a real power transferred in a radial line is P=Es.Er/X.Sin(δ). The max. power is achieved if sin(δ)=1 (δ=90o) and also if the receiving end and sending end voltages Es=Er. In this case PSIL = V2/Zc.
An example of the SIL as a useful indicator of the line performance is as follows: 1)Line loaded @ the surge impedance the voltage profile is constant along the line. 2) For load > SIL voltage is reduced at the receiving end and the opposite happens that may require shunt capacitor or reactor compensation for heavy and light load respectively.
As I understand this voltage drop will be worse when loaded above the line's SIL and/or with lagging load power factor. So basic voltage drop equations will not cover this.
Can you give a description of how to calculate voltage drop for lines loaded over SIL at 0.85PF?
Question- why delta (δ) and not phi in these equations? The equations I'm used to revolve around arcoss and phi ie cosine phi for power factor as part of voltage drop:
Ze = R × PF + X L sin[arccos(PF)]
also if the receiving end and sending end voltages Es=Er
Are you saying that at SIL loading at unity Power factor, a receiving voltage of say 140,000 volts will result in a load end voltage of 140,000 volts?
And, at loading below SIL, 140,000 volts
may rise to 141,000 volts?
d)What are the physics behind the steady-state stability limitation? A typical T. Line operate in the real world approx.: 350 <δ< 450 limiting the power transfer to approximate to 70% to allow enough margin to withstand any sudden transient distrurbance
NOTE: • < 90o stable region. • > 90o & < 135o transient region. • > 135o unstable region.
Noted. But what exactly makes it unstable though- tap changers or voltage that can not recover at the load? Or am I viewing this the wrong way?
Being honest half of this I'm starting to understand- a liken it to RL circuits with shunt capacitors and such. At least thats when I'm envisioning just evenly distributed across a 50-100 mile line.
Just have to get a better handle on the math.