geotechguy said:
Based on those factors of safety I will than calculate the probability of failure. Of course - there are a lot of assumptions involved (most importantly that I largely have to assume the probability distribution of the various parameters based on published ranges (eg. JM Duncan) calibrated against my site-specific CPT data to calculate the probability of failure for a given FS ?)
I don't know the way 3Dscoop calculates Factors of safety and if they are time-dependent (annualized) or not. But to transform them into probabilities of failure, I would need to calibrate the 3Dscoop Fs with a FS calculated probabilistically with suitable software (like rocscience SLIDE) or by a calc sheet. That is, on a small number of sample slopes, calculate both and see if they are more or less the same, and then see what's the corresponding Pf.
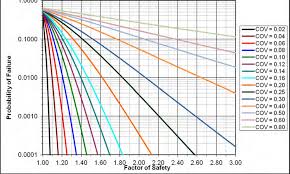
Unless somewhere in the literature there is a reliable study on the variability of FS in various conditions (like we know for example that the COV of sands is on average 5%), then you might apply the plot from Christian above posted. It would remain an imprecise estimate though.
From the parameters you collected, you could study how their variability propagates to the FS variability but, again, you would need software with probabilistic capabilities.
The most brutally imprecise estimate would be to adopt a range of technically plausible COVs and use Christian's plot to derive a range of plausible probabilities of failure. Obviously, that would not be very acceptable in the design of your hazard risk map.
One final consideration: if you have CPT data, assuming the soil has not a totally frictional behaviour, then you don't have a reliable value of c', which governs FS substantially, as has been suggested in the article posted by BigH. Then pairs of phi-c' values from lab tests would be needed.