TheGreenLama
Structural
My question sounds fairly basic, but as statistics is not my strong suit I'm asking it here.
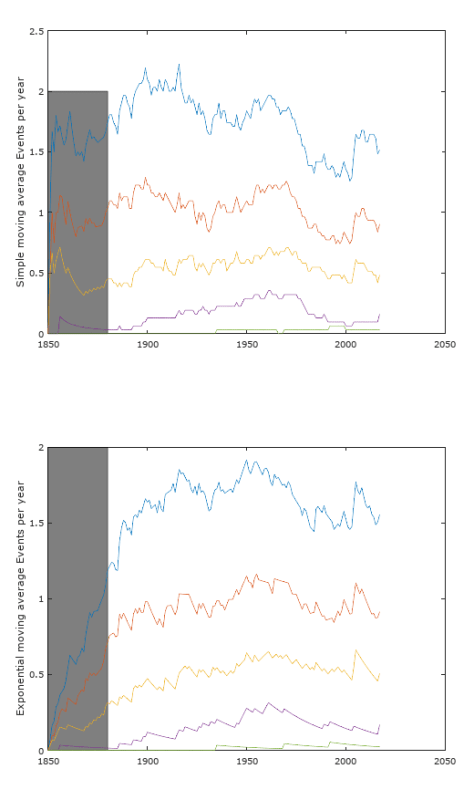
I have an event that happens irregularly over time, similar to, but not exactly like hurricanes. I know the time and date of each event, and thus the "time gap" between events. After each new occurrence I want to determine how frequently events are occurring, and thus if they are happening more or less often at that time. Then, after each new event, I'd update a graph and trends should emerge.
Do I use something like the exponential moving average (EMA) approach for an irregular time series to somehow calculate the average "time gap" after each new event, or is this way off? Another thought would be to instead use a fixed length of time and, after each new event, calculate the number of events per this fixed length of time to get a "running" frequency?