Fabian6669
Electrical
Hi there I am new to this forum.
I am doing a project about controlling a thermoelectric module, and for doing so I must reverse the current direction. This is achieved changing the voltage polarity. So the output of the controller (which is percentage) is going to control the voltage level, being:
0% --> -0.68 Volts
100% --> 1.02 volts
I attached a picture where is plotted the line related to %CO (controller ooutput) and voltage.
My concern is about how to apply the Laplace transform to the line itself, because if I consider deviation variables the free component of the line formula will disappear and the Laplace transform will be function only of the slope, which is not correct because doing so will give a error in the actual voltage needed. Other strategy that I could consider is to apply the Laplace Transform diretly to the line ecuation, but again I think is not appropriate because in that case I am not considering deviation variables.
Other strategy could be to use two block diagrams either one for positive values of voltage and the other one for negatives values.
I hope you guys can help me out.
Fabian.
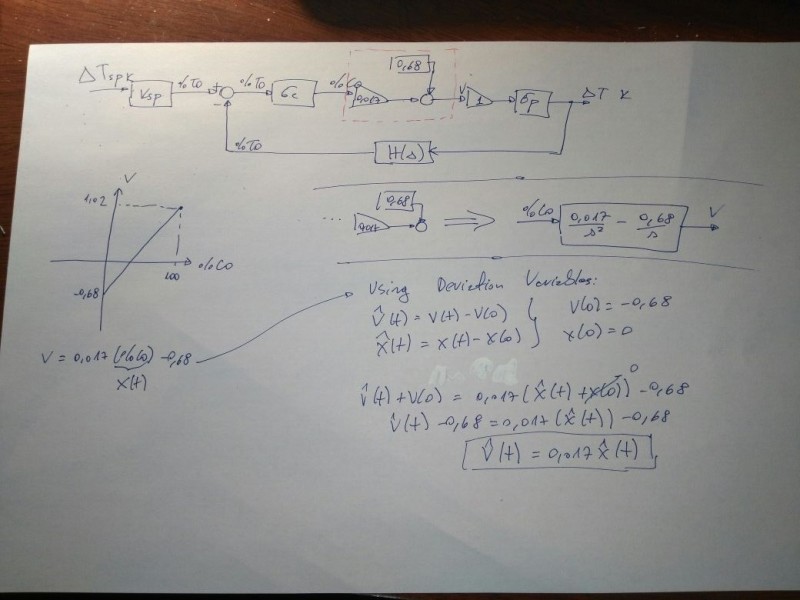