Continue to Site

Eng-Tips is the largest engineering community on the Internet

Intelligent Work Forums for Engineering Professionals

  • Congratulations waross on being selected by the Eng-Tips community for having the most helpful posts in the forums last week. Way to Go!

What is this Rm line in this biaxial interaction chart - Eurocode 2

Pretty Girl

Structural
Nov 22, 2022
153
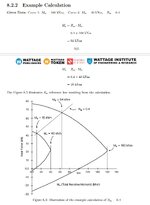
This chart is located in the book "Deep Surface" by Harshana Wattage, pg 148, about biaxial N-M interaction in columns. Their chart mentions something like Rm line, but I have seen these kind of lines in other old charts and they call it a different name. Most probably it refers to the same line. The book provides a way to calculate the lines and other things. But I'm not quite sure why do we need these lines. Can't we just be below the lines and call it a safe column design? I feel like we can even calculate the asfyk/ bhfck etc without those lines. What's the actual use of those?
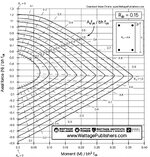

image2.jpg
 
Replies continue below

Recommended for you

This chart is located in the book "Deep Surface" by Harshana Wattage, pg 148, about biaxial N-M interaction in columns. Their chart mentions something like Rm line, but I have seen these kind of lines in other old charts and they call it a different name. Most probably it refers to the same line. The book provides a way to calculate the lines and other things. But I'm not quite sure why do we need these lines. Can't we just be below the lines and call it a safe column design? I feel like we can even calculate the asfyk/ bhfck etc without those lines. What's the actual use of those?

View attachment 8749
I don't know what the Rm lines are for, other than that they seem to be related to the balance moment, which affects the capacity reduction factor calculation in some codes (but not Eurocode 2). How does the book say it is calculated?
Incidentally, if I search for Deep Surface and the authors name the only relevant link that comes up is your post, but if I enter wattagepublishers.com it goes straight to the publishers site with this book displayed!

Yeah, I bought the book from the publisher site. It was popped in a facebook advertisement.
I just checked it out and bought. It's a new one it seems. New things are there.
It's well structured it seems, however some things are strange in it, which I don't understand.

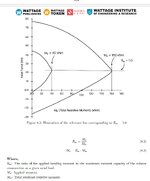
Regarding the calculation, it says it's the maximum moments and the intermediate ones are divided moments etc.
Divided equally? It has used a total moment in intermediate ones as well. Says applied moment to total moment ratio.
But What I don't get is how this "applied moment" applies to a N-M chart if we're targeting 0.4 line etc. We have not applied any moment yet. We're just creating the N-M chart. Where does this applied moment comes from?

11.jpg
12.jpg
 
I've been busy updating my biaxial bending spreadsheet, I'll post a link here when I publish it.

I think the text you posted is clear enough about what Rm is.

For instance, if you had a design bending moment of 40% of the maximum bending capacity, you could look at where the Rm = 0.4 line intersects the interaction line, and that gives you the maximum axial load for that moment.

It doesn't seem very useful though, unless I'm missing something. I wouldn't worry about it.
I agree with IDS. It just seems to be a visual indicator so you can easily see what % utilization you are at. So if you practiced with a philosophy of not specifying anything above 85-90% utilization, this is a graphical way to show you that.
 
I've been busy updating my biaxial bending spreadsheet, I'll post a link here when I publish it.

I think the text you posted is clear enough about what Rm is.

For instance, if you had a design bending moment of 40% of the maximum bending capacity, you could look at where the Rm = 0.4 line intersects the interaction line, and that gives you the maximum axial load for that moment.

It doesn't seem very useful though, unless I'm missing something. I wouldn't worry about it.

@IDS Thank you for the response.
I felt like the line is there as guidance, but still felt like there can be a specific use etc.
So, the 40% etc is there to check where our applied loads stand compared to maximum failure moment. Is that correct? That is useful when we actually checking the column using the chart, not for building the chart. Is that correct or I'm wrong?
 
I agree with IDS. It just seems to be a visual indicator so you can easily see what % utilization you are at. So if you practiced with a philosophy of not specifying anything above 85-90% utilization, this is a graphical way to show you that.

@EngDM Thank you for the response.

So it does have a very good reason to have that line in the charts. Yeah, it'll be useful if someone is following their own rules like 85% max etc.
 
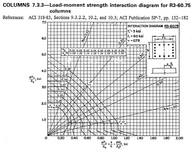
Each of those curves is a column strength curve for a with column increasing percentages of column reinforcing steel. ACI used to publish tables like these in the early 1970's. They were extremely useful tables and enabled designers to quickly design columns in less than a minute. All you needed was the factored axial load and moment. In the ACI tables (see below) the there was a curve for each percentage of steel from 0.01 through 0.08. (These tables were based on the old 1.4D and 1.7L load factors. I wish ACI would update and republish these tables for the current 1.2D and 1.6L load factors.) The tables were also great for coming up with preliminary column sizes. I would just strive to stay at or below 2%.
1746415510698.png
 

Part and Inventory Search

Sponsor