Hi All,
If I have a set data of Voltages from a high-power substation, persay, and I have already calculated the Short Term Percentile over the following percentages, how do I graph these values against number of fluctuations per hour per IEEE 1453.
I'm having a hard time understanding the duration calculated and plotting these against the short term percentile calculated.
There's a matlab code, which I used for reference, which I'm trying to streamline into Microsoft Excel.aaa
Attached is the graph I'm trying to imitate. Most importantly, the flicker voltages "A" and "C"
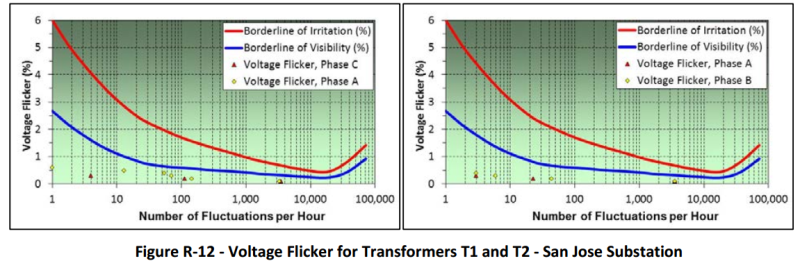
Background is voltage measurements taken from a powerstation in 3 phases (A, B, C).
Best,
Will
If I have a set data of Voltages from a high-power substation, persay, and I have already calculated the Short Term Percentile over the following percentages, how do I graph these values against number of fluctuations per hour per IEEE 1453.
I'm having a hard time understanding the duration calculated and plotting these against the short term percentile calculated.
There's a matlab code, which I used for reference, which I'm trying to streamline into Microsoft Excel.aaa
Attached is the graph I'm trying to imitate. Most importantly, the flicker voltages "A" and "C"
Background is voltage measurements taken from a powerstation in 3 phases (A, B, C).
Best,
Will