Continue to Site

Eng-Tips is the largest engineering community on the Internet

Intelligent Work Forums for Engineering Professionals

  • Congratulations KootK on being selected by the Eng-Tips community for having the most helpful posts in the forums last week. Way to Go!

Transient heat transfer problem

Status
Not open for further replies.

hdz

Mechanical
Jun 3, 2015
3
Hello

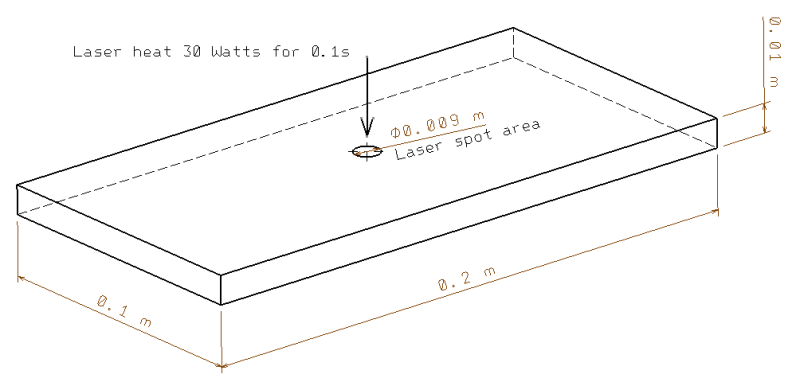
I'm performing transient heat transfer analysis and since i've never done it before I have encountered some problems. The task is to compare the results made in FEA software to an experiment. I have a low carbon steel plate ( 0.2x0.1x0.01 m dimensions ) which is excited by a laser on a top surface ( 30 Watts in 0.1s , laser spot radius = 0.0045m ) and then thermal imaging camera aquires image.
picture_cnajhw.png

Then Im doing analysis in MSC Marc software.
Here's data :
Model units : m
MATERIAL PROPERTIES :
Thermal conductivity = 54 W/m*C
Specific heat = 465 J/kg*C
Density = 7863 kg/m^3
Intial temperature = 23.7586 C
Heat flux = 30W / Area , where Area = pi * 0.0045^2 which gives 471570 W/m^2
Surface heat flux = 471570 * exp(-((time-0.95)^2)/0.01) - assuming gauss distribution function
model1_dn2lin.png

Natural convection coefficient = 10 W/m^2*C
Ambient temperature = 23 C
Film applied on whole top and bottom surface
model2_uotuep.png

Analysis type transient with 200 increments, which gives constant time step 0.008s , total time 1.6s
Finally , im comparing the temperatures 5 mm away from the heat source and here's what i get :
graph_bcad9b.png

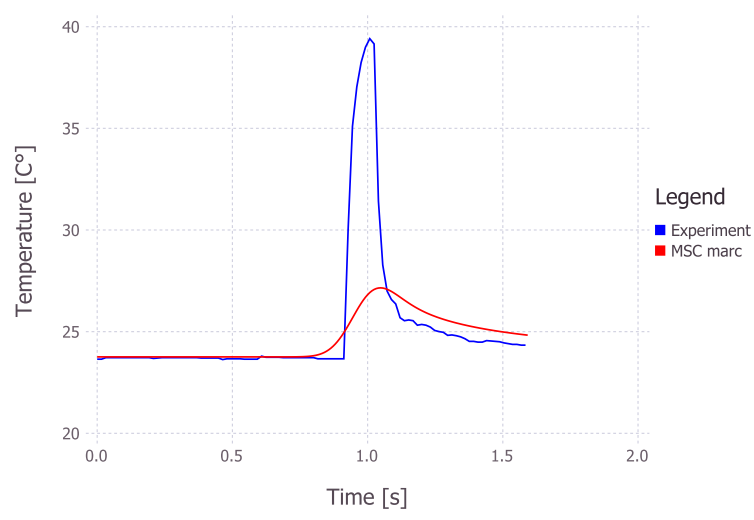
I've expected the result to be different, but not that much....
I'd be very grateful if someone could verify input data / units and provide me guidance what could be wrong here.

Regards
Mike
 
Replies continue below

Recommended for you

I'd ignore convection, as it would take time for convection currents (bouyancy driven flow) to develop in the real world, and just model conduction into the plate.
 
The temperature distribution after the 'event' is close to the experimental values, albeit slightly higher in value. For natural convection the value under the plate tends to be less than that above the plate. Also you should have convection from the sides of the plate too. That may get the predicted values closer to the experimental values after the 'event'.
In general though, you should use symmetry to reduce the model size. With a smaller model you could then put more elements into the centre and surrounding region, and through the thickness, to reduce the mesh size. Also use a very small initial time step, and allow automatic time steps. It may be that the constant value you've chosen isn't small enough to capture the change in temperature for this severe transient.

 
What film are you applying?

5 mm away in which direction?

TTFN
faq731-376
7ofakss

Need help writing a question or understanding a reply? forum1529


Of course I can. I can do anything. I can do absolutely anything. I'm an expert!
There is a homework forum hosted by engineering.com:
 
Okay, a little update, thank you for all your support. I've decided to neglect convection as btrueblood suggested, because it doesn't affect temperatures at all. Also the reason behind using constant step is that I can adjust numerical result by using least squares method for discrete data and minimizing the sum, since infrared camera records at 60 FPS so it gives 1 frame per 0.016s and step in my model has to be multiplicity of it. Step i'm using is small enough, i've checked with automatic time steps and very small initial step and result is similar. Also FEA model is a half of the plate ( 100x100x10 mm ) and it is symmetrical, mesh is pretty dense in the center where flux is applied. Here is close look on a laser spot from camera image at peak.
ja9mvbT.png

It has an eliptical shape, because camera is mounted near laser at some angle so image is a bit deformed. I've done some math and converted the distance from pixels to mm , the point that is marked is 5mm away from the center. Now , i've increased to power from 30W to 178W which gives flux = 2806947 W/m^2 ,reduced gauss function width by half to adjust the amplitude and here's what i get :
AEHkTjm.png

For now it's a bit sloppy ( I will adjust it later ), but now, since it's pure conduction , how can I adjust drop in temperature to fit experimental result?

Regards
Mike
 
If the plate is 100 x 100 and you've used symmetry, then why is your model dimension 200 x 100? If you use symmetry across two planes then you'd have a square model of 50 x 50 with the heat source as a quarter circle placed at the corner of the plate.
In general though, the experimental results show the typical saw tooth variation in temperature, where temperatures increase rapidly and then tend to some steady state value before falling away quickly as the heat source is removed. Your FE results don't show that same variation at all even though you've increased the heat source some how to achieve the same peak value. I'd advise getting the geometry right and I'd still advise refining the mesh to see how that effects the results. In general the heat source causes a local surface change in temperature, and with only 5 elements through the thickness you're not going to pick that up accurately. That may affect results along the length of the plate.

 
I think you've basically gamed the simulation. By dumping a higher power, you've created the illusion that the results are comparable, but since you've not changed anything, other than the convection, the model behavior is still not correct. It's just that you've effectively moved your measurement point closer to the bulk of the heat flow.

How did you account for emissivity and reflectivity, which are not necessarily equatable, since your laser is only a single wavelength, but emissivity is broadband.

One obvious problem is that you somehow decided to make the time step and the camera frame time the same, which is not correct. The camera only records at 60 Hz, but that does not mean that the physical process does not proceed in between the frame exposures. Your time step is forcing all the action to be locked into the 60 Hz time step, but that's unrealistic.

TTFN
faq731-376
7ofakss

Need help writing a question or understanding a reply? forum1529


Of course I can. I can do anything. I can do absolutely anything. I'm an expert!
There is a homework forum hosted by engineering.com:
 
What wavelength is the laser working at? If it's an IR laser, or even a visible light laser, I would worry that the camera is being "spoofed" by reflected laser radiation, i.e. the peak reading is artificially high in the camera data. To confirm this, I might try fitting the decay curve to a smooth exponential function, and see what peak temp it extrapolates to at time = cutoff. Another method might be to use a very thin foil test article, and image the backside with the camera.
 
Wavelength is 805,22 [nm]
DoKH4.jpg

I also forget to mention that the steel sample is painted in black .
 
Another simulation run you might try is to put an initial temperature distribution on the surface layer of elements, and see if you can match the decay curve of the experimental data. You may need to thin out the surface layer so that the mCpdT of the layer matches the incoming watt-seconds of energy delivered by the laser.
 
Status
Not open for further replies.

Part and Inventory Search

Sponsor