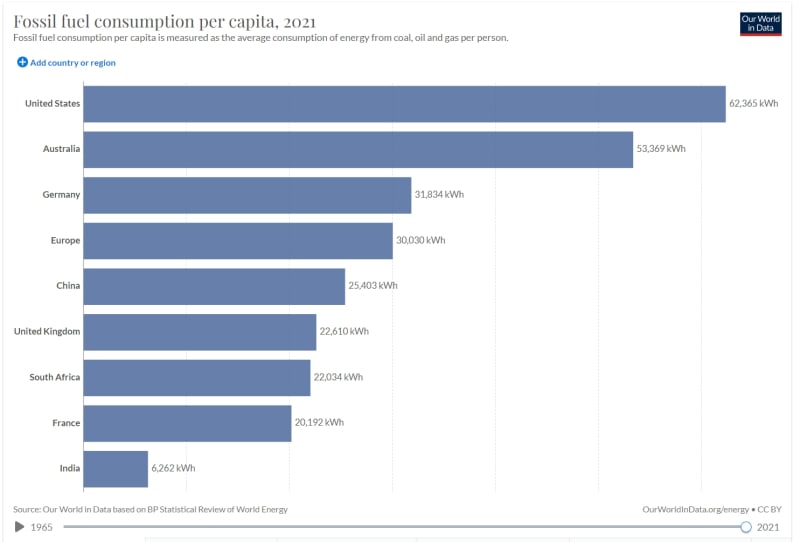
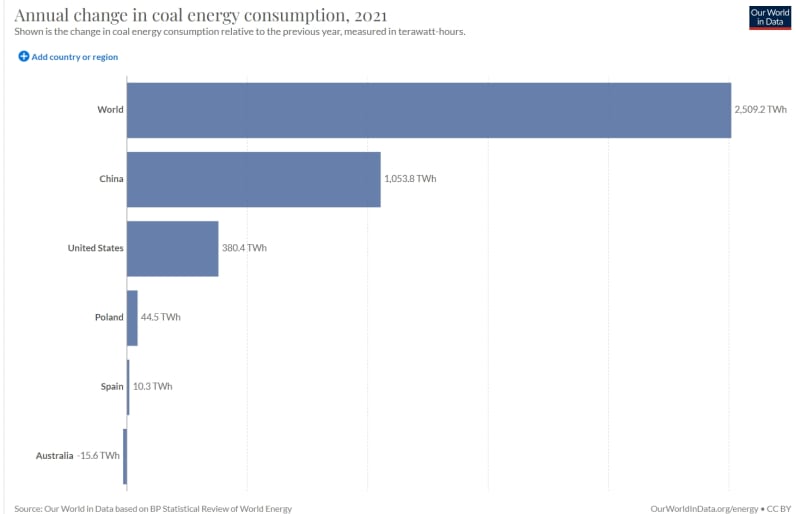
Coal consumption by country, China uses more than half of the total global figure
Country Yearly Coal Consumption
(MMcf) World
Share Cubic Feet
Per Capita
1 China 4,319,921,826,000 50.5 % 3,055.00
2 India 966,288,692,600 11.3 % 729.54
3 United States 731,071,000,000 8.5 % 2,263.27
4 Germany 257,488,592,900 3.0 % 3,132.70
5 Russia 230,392,143,100 2.7 % 1,585.90
6 Japan 210,559,949,300 2.5 % 1,648.05
7 South Africa 202,298,474,200 2.4 % 3,599.13
8 South Korea 157,124,158,500 1.8 % 3,081.87
9 Poland 148,799,901,400 1.7 % 3,916.90
10 Australia 129,642,679,100 1.5 % 5,343.29
11 Turkey 116,877,929,300 1.4 % 1,464.12
12 Indonesia 102,623,737,100 1.2 % 392.36
13 Kazakhstan 86,633,849,830 1.0 % 4,858.64
14 Taiwan 72,649,581,410 0.8 % 3,076.00
15 Ukraine 59,357,188,880 0.7 % 1,327.49
16 Vietnam 56,641,097,040 0.7 % 604.88
17 Czech Republic (Czechia) 49,418,771,720 0.6 % 4,653.87
18 Serbia 43,189,608,110 0.5 % 4,878.00
19 Canada 42,907,416,750 0.5 % 1,179.33
20 Thailand 42,674,985,870 0.5 % 618.74
21 United Kingdom 41,459,830,190 0.5 % 625.36
22 Greece 38,077,094,330 0.4 % 3,587.04
23 Bulgaria 35,234,236,840 0.4 % 4,926.52
24 Malaysia 33,022,853,070 0.4 % 1,076.20
25 Brazil 27,275,972,010 0.3 % 132.30
26 Romania 26,886,238,620 0.3 % 1,358.15
27 Mexico 22,478,332,230 0.3 % 182.26
28 Philippines 22,372,483,760 0.3 % 215.82
29 Spain 21,948,094,410 0.3 % 470.64
30 Italy 18,787,634,320 0.2 % 309.70
31 Netherlands 18,203,547,340 0.2 % 1,071.98
32 Chile 14,077,601,010 0.2 % 773.11
33 France 12,900,349,260 0.2 % 199.49
34 Hong Kong 12,303,072,610 0.1 % 1,698.49
35 Hungary 11,663,542,110 0.1 % 1,195.90
36 Colombia 11,385,457,170 0.1 % 236.34
37 North Korea 10,707,839,340 0.1 % 423.11
38 Pakistan 10,199,674,430 0.1 % 50.09
39 Israel 10,167,719,520 0.1 % 1,253.88
40 Bosnia and Herzegovina 9,466,163,184 0.1 % 2,795.46
41 Mongolia 8,823,723,592 0.1 % 2,887.00
42 Morocco 7,153,991,900 0.1 % 203.66
43 Slovakia 6,708,666,633 0.1 % 1,232.76
44 North Macedonia 5,987,017,899 0.1 % 2,877.35
45 Finland 5,310,768,554 0.1 % 966.00
46 Portugal 5,290,177,075 0.1 % 512.34
47 Laos 5,247,933,857 0.1 % 766.59
48 Uzbekistan 4,770,797,680 0.1 % 151.73
49 Slovenia 4,143,583,290 0.0 % 1,997.67
50 Belgium 4,035,556,910 0.0 % 355.42
51 Denmark 3,985,952,960 0.0 % 697.90
52 Austria 3,886,745,060 0.0 % 444.34
53 Zimbabwe 3,388,555,286 0.0 % 241.52
54 Sweden 2,857,190,916 0.0 % 290.48
55 New Zealand 2,765,589,930 0.0 % 593.57
56 Ireland 2,474,685,950 0.0 % 527.00
57 United Arab Emirates 2,454,173,243 0.0 % 262.17
58 Kyrgyzstan 2,447,128,200 0.0 % 402.86
59 Sri Lanka 2,295,009,420 0.0 % 109.18
60 Bangladesh 2,099,900,000 0.0 % 13.29
61 Afghanistan 1,871,722,380 0.0 % 52.90
62 Guatemala 1,751,570,590 0.0 % 105.62
63 Cambodia 1,625,907,250 0.0 % 103.13
64 Puerto Rico 1,565,870,822 0.0 % 476.95
65 Tajikistan 1,511,267,010 0.0 % 174.44
66 Montenegro 1,500,243,910 0.0 % 2,391.73
67 Iran 1,472,686,160 0.0 % 18.51
68 Argentina 1,403,477,115 0.0 % 32.26
69 Botswana 1,356,943,610 0.0 % 628.24
70 Peru 1,267,656,500 0.0 % 40.99
71 Dominican Republic 1,215,241,660 0.0 % 116.88
72 Croatia 1,179,627,009 0.0 % 280.29
73 New Caledonia 1,155,220,880 0.0 % 4,213.20
74 Norway 824,527,880 0.0 % 157.02
75 Mauritius 772,967,330 0.0 % 612.56
76 Egypt 769,412,380 0.0 % 8.15
77 Singapore 761,679,182 0.0 % 134.72
78 Belarus 681,227,580 0.0 % 72.12
79 Madagascar 566,337,256 0.0 % 22.75
80 Ethiopia 539,255,173 0.0 % 5.20
81 Kenya 537,358,860 0.0 % 10.95
82 Myanmar 536,769,855 0.0 % 10.12
83 Senegal 448,640,170 0.0 % 29.92
84 Georgia 419,462,024 0.0 % 104.46
85 Kuwait 387,108,873 0.0 % 97.83
86 Panama 330,693,000 0.0 % 81.91
87 Tanzania 327,860,928 0.0 % 6.18
88 Nepal 283,302,995 0.0 % 10.39
89 Lithuania 272,313,067 0.0 % 94.24
90 Niger 261,247,470 0.0 % 12.57
91 Jordan 242,508,200 0.0 % 25.38
92 Switzerland 199,518,110 0.0 % 23.81
93 Nigeria 193,329,582 0.0 % 1.04
94 Zambia 183,692,986 0.0 % 11.23
95 Honduras 180,778,840 0.0 % 19.50
96 Venezuela 180,696,035 0.0 % 6.05
97 Togo 161,047,737 0.0 % 21.44
98 Eswatini 159,863,179 0.0 % 143.50
99 Moldova 137,788,750 0.0 % 33.89
100 Iceland 136,686,440 0.0 % 411.45
101 Lebanon 135,975,839 0.0 % 20.25
102 Yemen 133,379,510 0.0 % 4.91
103 Saudi Arabia 122,986,931 0.0 % 3.79
104 Bhutan 96,000,000 0.0 % 130.31
105 Albania 95,900,970 0.0 % 33.22
106 Oman 94,990,251 0.0 % 21.21
107 Luxembourg 89,198,115 0.0 % 153.99
108 Benin 87,775,843 0.0 % 8.07
109 Malawi 85,915,364 0.0 % 4.99
110 Jamaica 80,468,630 0.0 % 27.69
111 Latvia 67,861,344 0.0 % 34.37
112 Algeria 27,321,049 0.0 % 0.67
113 Estonia 19,762,405 0.0 % 15.01
114 Ecuador 13,555,288 0.0 % 0.82
115 DR Congo 12,538,033 0.0 % 0.16
116 Mozambique 12,125,410 0.0 % 0.44
117 Syria 5,526,160 0.00 % 0.32
118 Namibia 5,523,724 0.00 % 2.34
119 Tunisia 2,259,332 0.00 % 0.20
120 Cuba 2,066,443 0.00 % 0.18
121 Paraguay 1,679,929 0.00 % 0.25
122 Armenia 1,322,685 0.00 % 0.45
123 Uruguay 436,631 0.000 % 0.13
124 Cyprus 223,541 0.000 % 0.19
125 Trinidad and Tobago 198,416 0.000 % 0.14
126 Azerbaijan 178,010 0.000 % 0.02
127 Costa Rica 109,768 0.000 % 0.02
128 Malta 56,098 0.0000 % 0.13
129 Ghana 17,099 0.0000 % 0.00
130 Fiji 710 0.0000 % 0.00
Sources
Statistical Review of World Energy - British Petroleum
U.S. Energy Information Administration (EIA)
Cheers
Greg Locock
New here? Try reading these, they might help FAQ731-376