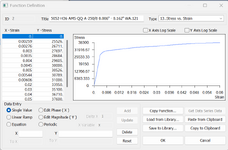
Is there a firm number of allowable entries for a Stress-Strain curve when defining a material for plasticity?
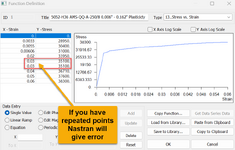
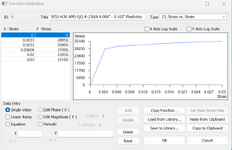
I created a function with 10 entries and my model continues to fail giving the FATAL message below. A review of the QRG and everything looks OK so I experimented by deleting entries from the function. At 6 entries on the stress-strain curve the model runs just fine. I experimented with the magnitudes of the entries as well and, in all cases, the model solved provided I have no more than 6 entries.
This is just a simplified test model without consequence, but what if I needed more stress strain entries that 6? Am I simply missing the obvious?
Thank you!
*** USER FATAL MESSAGE 316 (IFPDRV)
ILLEGAL DATA ON BULK DATA ENTRY TABLES1
User information:
See Bulk Data entry description in Section 5 of the NASTRAN
Quick Reference Guide. If you are using the large field format make
sure the number of entries is even.
TABLES1 1 +0000004
+0000004 0. 0. .0033 28950. .0055 30400. .00606 31000.+0000005
+0000005 .02 33950. .03 35100. .03 35100. .04 36710.+0000006
+0000006 .05 37600. .06 38300.ENDT
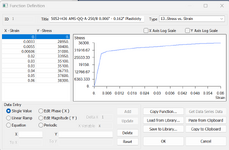
$COM 0 24.2 5052-H36 AMS-QQ-A-250/8 0.006" - 0.162" Plasticicty Updated
-1
420
2,13,
5052-H36 AMS-QQ-A-250/8 0.006" - 0.162" Plasticicty
1,0.,0.,
2,0.0033,28950.,
3,0.0055,30400.,
4,0.00606,31000.,
5,0.02,33950.,
6,0.03,35100.,
7,0.03,35100.,
8,0.04,36710.,
9,0.05,37600.,
10,0.06,38300.,
-1,0.,0.,
-1


