Shravana Umesh
Student
Hi all!
I am covering a steady-state thermal analysis simulation of a gear tool. The first image is the figure of the model. The tool is in contact with the workpiece from the beginning for 5 seconds and then is moved away.
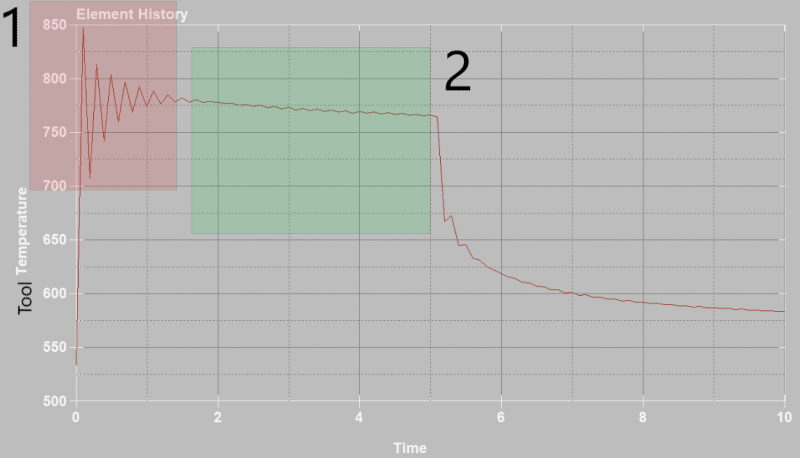
The second image is the result of my simulation. After adjusting the contact distance, this is the closest I could get to my intended temperature curve. I have marked two regions: Area 1 (red box) and Area 2 (green).
There is a fluctuation in tool temperature in Area 1 even though there is no movement.
The temperature is slightly decreasing in Area 2 whereas it should be increasing.
What checks can I do in LS-Dyna to ensure I get the correct trend?
Thank you!
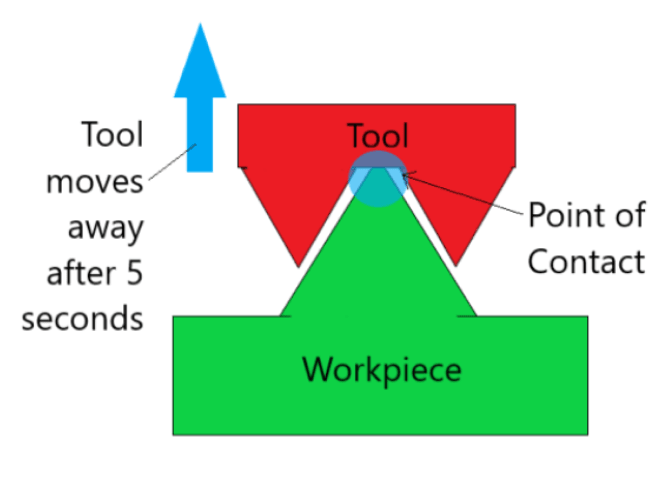
I am covering a steady-state thermal analysis simulation of a gear tool. The first image is the figure of the model. The tool is in contact with the workpiece from the beginning for 5 seconds and then is moved away.
The second image is the result of my simulation. After adjusting the contact distance, this is the closest I could get to my intended temperature curve. I have marked two regions: Area 1 (red box) and Area 2 (green).
There is a fluctuation in tool temperature in Area 1 even though there is no movement.
The temperature is slightly decreasing in Area 2 whereas it should be increasing.
What checks can I do in LS-Dyna to ensure I get the correct trend?
Thank you!