Tek-Tips is the largest IT community on the Internet today!

Members share and learn making Tek-Tips Forums the best source of peer-reviewed technical information on the Internet!

  • Congratulations TugboatEng on being selected by the Eng-Tips community for having the most helpful posts in the forums last week. Way to Go!

Isolating elements above/below stress or strain values (visualization)

Status
Not open for further replies.

sbasude

Mechanical
Joined
Jul 30, 2019
Messages
7
Location
US
Hello,

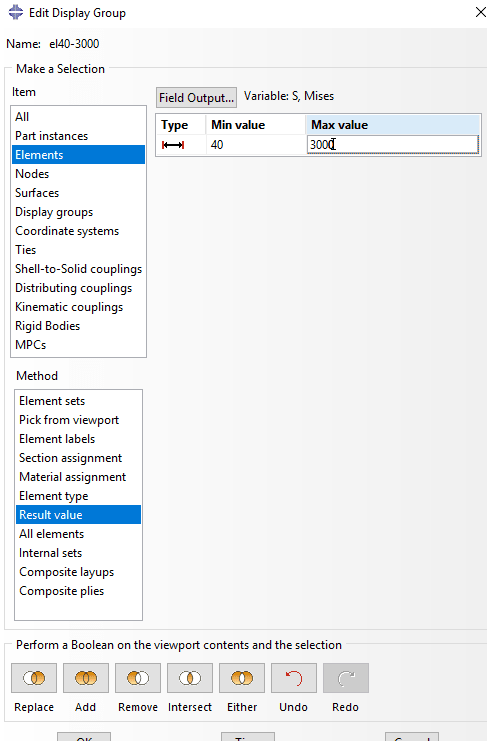
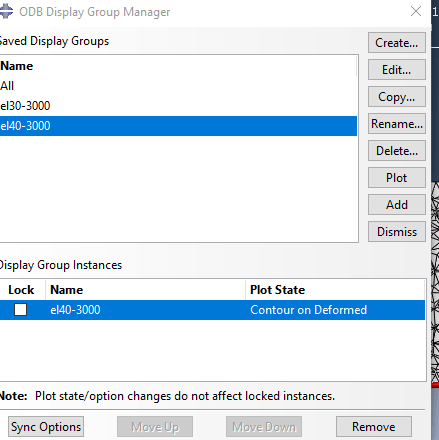
I would like to isolate elements above or below certain stress/strain levels. This was easy to do in Hypermesh, where you can use a slider that controls which elements are seen by revealing clusters of elements based on the slider position. Is this possible in Abaqus 2018? I found section cutting but nothing like what I described. Thanks
 
Yes, you can create a display group based on the range of values of selected output variable: Create Display Group --> Elements --> Result value.
 
@FEA way, thanks so much. However, I tried doing this and clicking plot, but none of the elements are changing in view after I press plot.

Capture_bsyff8.png

Capture2_qypgjm.png
 
In the first window click Replace button. This way elements with stress between 40 and 3000 will be isolated from the rest. Unless all elements are in this range ...
 
This worked!
Thanks so much.
 
Status
Not open for further replies.

Part and Inventory Search

Sponsor

Back
Top