I need to do a sweep study (parametric study) - to see how the plot (Fig.3) will change when I change the geometric parameters "a_1", "b" and "t". I first do a cell periodicity study to find effective material properties for a set of "a_1", "b" and "t". Based on this data I need to do a linear buckling analysis, which gives me the plot in Fig.3. I have done this succesfully for a given value of "a_1", "b" and "c" - but im not sure how to do this for multiple sets of "a_1", "b" and "c". (Besides doing it manually of course).
Fig.1 This study finds the elasticity matrix for varying geometry defined by "a_1", "b" and "c"
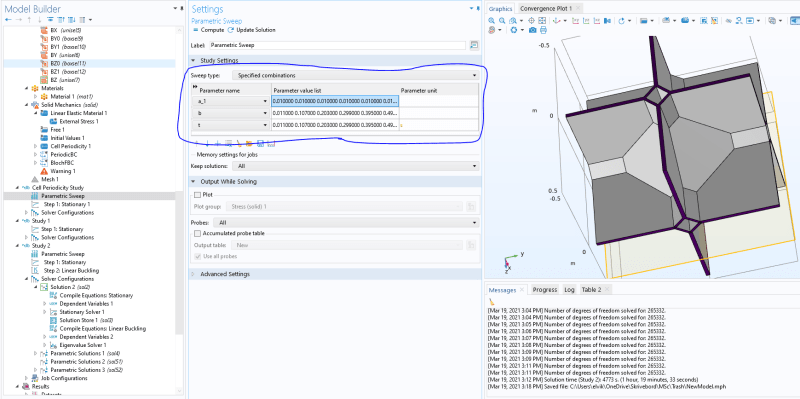
Fig 2: Want to do a sweep over these "k" values for sets of "a_1", "b" and "c".
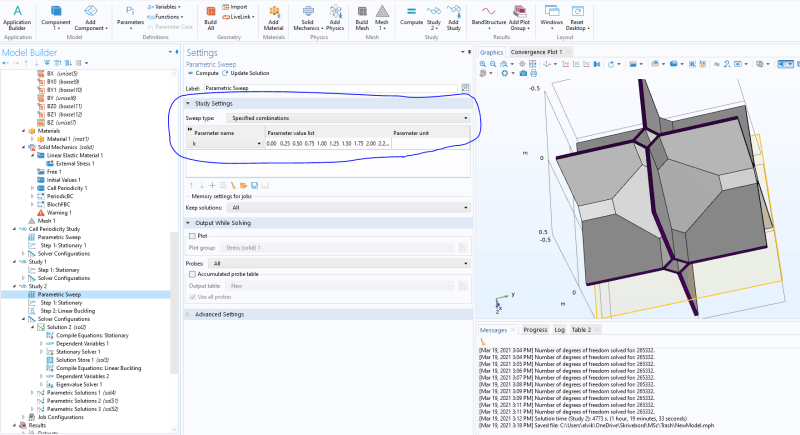
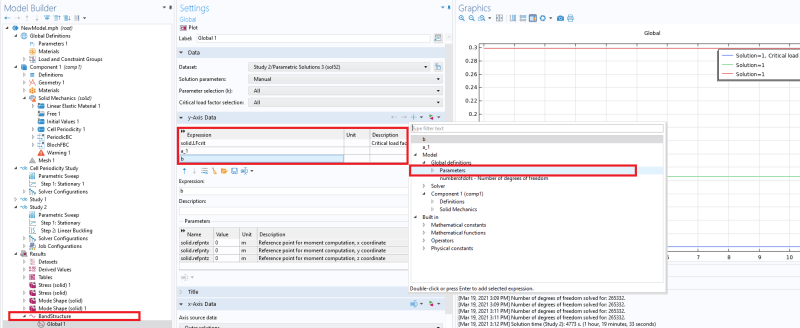
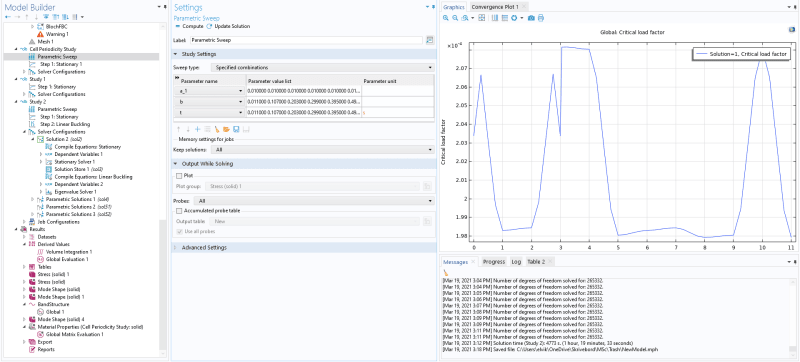
Fig 3: This is a plot for a given value of "a_1", "b" and "t". Basically I want to see how this plot changes as "a_1", "b" and "t" changes.
Ps. I dont want this plot for all combinations of "a_1", "b" and "t", but for sets of "a_1", "b" and "t".
Fig.1 This study finds the elasticity matrix for varying geometry defined by "a_1", "b" and "c"
Fig 2: Want to do a sweep over these "k" values for sets of "a_1", "b" and "c".
Fig 3: This is a plot for a given value of "a_1", "b" and "t". Basically I want to see how this plot changes as "a_1", "b" and "t" changes.
Ps. I dont want this plot for all combinations of "a_1", "b" and "t", but for sets of "a_1", "b" and "t".