A system curve for a flat profile pipeline can de developed from pressure drop calculations.
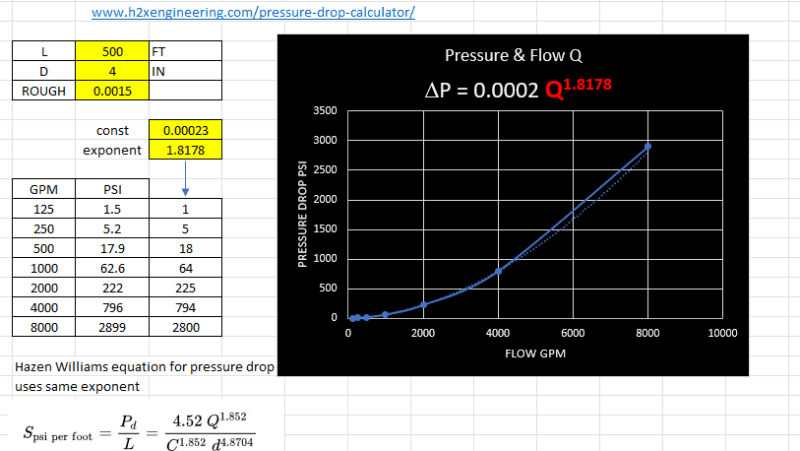
You can use the pressure drop calculator at h2xengineering.com (addressed in the picture).
You run the calculator for a number of different flow rates and connect the dots to get the system curve.
This system curve is for a flat profile pipeline with one pipe diameter.
If you have two or more pipe diameters, you can run the calculator for each diameter at the same flow rate, then add the results together.
If you have an outlet higher than the inlet, then the curve starts above the origin by the amount of the elevation rise (converted to pressure, if you are making a pressure system curve diagram, rather than a head diagram.) If your outlet is lower than your inlet, you would start the curve below the origin. Generally it is better to make diagrams using head, in feet, or meters, rather than pressure, although you can choose whatever way suits your requirements.
Note that n in Q^n is closer to n=1.82 rather than 2.
--Einstein gave the same test to students every year. When asked why he would do something like that, "Because the answers had changed."