Continue to Site

Eng-Tips is the largest engineering community on the Internet

Intelligent Work Forums for Engineering Professionals

  • Congratulations cowski on being selected by the Eng-Tips community for having the most helpful posts in the forums last week. Way to Go!

Flight test on aircraft's parasite drag 1

Status
Not open for further replies.

I_love_aircraft

Aerospace
Feb 16, 2017
6
Hi all,

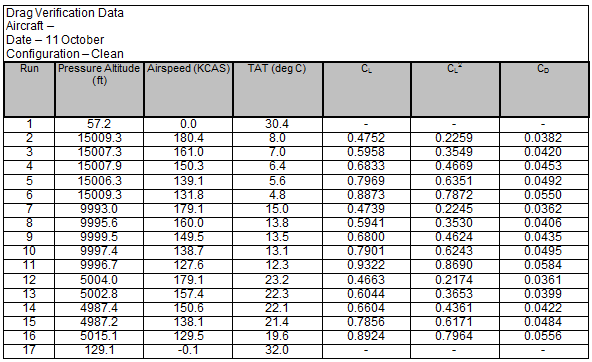
So I am working on a project (Flight testing) which requires me to calculate the parasite drag of the aircraft. The following are the parameters provided:

1. Pressure altitude (feet)
2. Airspeed (KCAS)
3. TAT (degree Celsius)
4. CL (Lift coefficient)
5. CL Square
6. CD (Drag Coefficient)

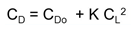
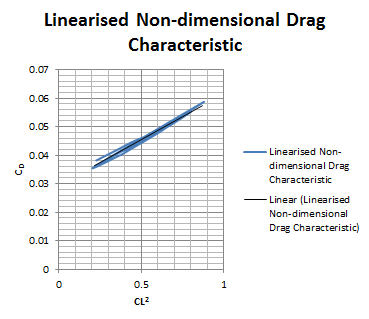
Understand that the value of the parasite drag (CD0) can be obtained by plotting the drag polar curve (CL vs CD) and the minimum CD point at the left-most point on the plot, where the drag is locally independent of lift would be CD0. Example of a drag polar curve:
[highlight #EF2929]Question is only the data of CL and CD are being used to determine the parasite drag, are the other data (pressure altitude, airspeed and TAT) useful in determine the parasite drag?[/highlight] I know that air density decreases with increased altitude and that affects both the value for CL and CD. CL and CD also decrease as velocity increases. Since values of CL and CD are provided in this case, I am not sure if the value of both pressure altitude and airspeed are of any use.

Also since I am relatively new to flight testing, are there any recommendations or pointers that I would have to take note when conducting this experiment?
 
Replies continue below

Recommended for you

1) read the graph more carefully, Cdo is not the minimum, but the value of CD when Cl=0.

so you're given Cl and Cd at a bunch of points, and need to plot the drag polar ?

Then you need to calculate the parasitic drag (force, not Cd0) ... and the equation for drag force is ...


another day in paradise, or is paradise one day closer ?
 
Hi rb1957,

thanks for the clarification on the Cd0, yes it is the value of CD when CL=0, my mistake.

attached is the set of data collected from the test flight and the drag polar (CL vs CD) plotted by me using excel. Based on the drag polar plot, how do I determine the Cd0 (parasite drag) as I do not see the curve touching CL=0. Am I plotting it wrongly? I used all the CD and CL values computed from various altitude on the plot.

Flight data:
Data_whtn85.png


Drag polar:
Drag_polar_droajo.png


OR

should I plot CD against CL square and form a best fit line and deduce the value for the constants Cd0 based on the drag polar equation as shown:

Drag_polar_equation_lymi6e.png


following is the CD against CL square curve that I have plotted using excel:

CLvsCD2_trxhez.png


Can i say that Cd0 is the value where the best fit line touches y-axis?

Hope you can help me to clarify my doubts, many thanks!
 
personally I'd plot the Cl vs Cd graph with three different data sets (for each altitude), get the best fit parabola equation for each (to see if they all agree).

You might get the same answer from the Cl^2 vs Cd plot.

Are you sure this isn't homework ?

another day in paradise, or is paradise one day closer ?
 
Hi rb1957,

this is not homework, I've long graduated but still kind of lost in this topic haha!

Can I clarify that so for the second method for finding Cd0 (CD against CL square), if 3 different data sets (for each altitude) are being plotted separately, wouldn't I be seeing 3 different Cd0 values? So this links to the next question:
does value of Cd0 changes with different altitude? I only know that CD and CL do as they are affected by air density (density reduces as altitude increase) and velocity.

Or do I compute a best fit line out of the 3 curves like what I did (as posted above) and get the cd0 value that touches the y-axis.

Your help would be greatly appreciated, thanks!
 
Cd0 "should" be a property of the plane, and I suspect you're right (that the three sets will give three different answers); and the best fit of all data would give another. I suspect if you go the drag polar route you'll get another three (or four !?) answers !

average them all ??

another day in paradise, or is paradise one day closer ?
 
ILA...

May/May-not find following documents of interest...

AGARD-AG-264 Aircraft Excrescence Drag [ADA106030]
AIAA 2014-2866 A Study of Airplane Excrescence Drag arc.aiaa.org/doi/pdf/10.2514/6.2014-2866

Fluid-Dynamic Drag Hoerner [Book]

Boeing AERO magazine Q1 2013 Article Surface Coatings and Drag Reduction
Regards, Wil Taylor

o Trust - But Verify!
o We believe to be true what we prefer to be true. [Unknown]
o For those who believe, no proof is required; for those who cannot believe, no proof is possible. [variation,Stuart Chase]
o Unfortunately, in science what You 'believe' is irrelevant. ["Orion", Homebuiltairplanes.com forum]
 
Hi rb1957,

Basically the objective of this project is to compare the Cd0 (parasite drag) of an aircraft with clean configuration and with installed structural modification. Of cause there is another set of similar flight data (also collected at 3 different altitude) for the aircraft with installed structural modification and is not posted here.

So to do that, I am thinking of obtaining the three x Cd0 values (due three different altitude) for the aircraft with clean configuration and three x Cd0 values for the aircraft with installed structural modification via the CD against CL square plot. And do a comparison on them. Not sure if this is the right way to do it, just looking out for suggestion.

Also is the TAT (Total air temperature) data provided even required for this experiment? Seems useless to me...


Your help would be greatly appreciated, thanks!
 
wouldn't the difference between the two show up as the delta between the two plots ? ie wouldn't a change in Cd0 translate the drag polar ?

another day in paradise, or is paradise one day closer ?
 
Also may find useful...

AGARD-R-654 Special Course on Concepts for Drag Reduction

AGARD-R-723 Aircraft Drag Prediction and Reduction

AGARD-LS-67 Prediction Methods for Aircraft Aerodynamic Characteristics

Regards, Wil Taylor

o Trust - But Verify!
o We believe to be true what we prefer to be true. [Unknown]
o For those who believe, no proof is required; for those who cannot believe, no proof is possible. [variation,Stuart Chase]
o Unfortunately, in science what You 'believe' is irrelevant. ["Orion", Homebuiltairplanes.com forum]
 
Hi all,

so I have managed to compute the Cdo (parasite drag) for the aircraft in clean configuration and with structural modification and are as follow:

Clean Config
@15k feet, Cd0= 0.0316
@10k feet, Cd0= 0.0282
@5k feet, Cd0= 0.0279

Structural modified
@15k feet, Cd0= 0.0308
@10k feet, Cd0= 0.0288
@5k feet, Cd0= 0.0295

Based on the comparison of the 2 different configurations (Cd0 obtained @15k feet for clean config is compared with Cd0 obtained @15k feet for structural modified etc...)
Observation: Differences in the value of Cd0 tends to be more significant (wider) when the aircraft is in a lower altitude. why is this so...? any idea?


is 15000' right ? (more drag in clean config ??)

another day in paradise, or is paradise one day closer ?
 
Hi rb1957,

it is computed from the flight data recorded. Hmmmmm... probably I would suggest one more run to verify the flight data @15k feet in clean configuration, what do you think?

and I observed that difference between the Cd0 values of clean and structural modified configurations tend to be more significant (wider) when the aircraft is in a lower altitude, any rational behind it?

Your help would be greatly appreciated, thanks!
 
Status
Not open for further replies.

Part and Inventory Search

Sponsor