Tek-Tips is the largest IT community on the Internet today!

Members share and learn making Tek-Tips Forums the best source of peer-reviewed technical information on the Internet!

  • Congratulations cowski on being selected by the Eng-Tips community for having the most helpful posts in the forums last week. Way to Go!

Excel Regression Multivariable

Status
Not open for further replies.

Allan92

Industrial
Joined
Aug 31, 2016
Messages
2
Location
US
Hi,

I'm working in a worksheet that calculates all the regression types, linear and non-linear equations. But I'm using more than two independent variables(eg. X1,X2,X3,X4).I'm using the Excel formula =LINEST(), but I don't know how to introduces the information on "Knows_x's".

blob_mglcg1.png


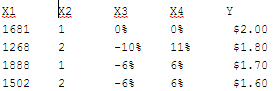
For the Multi variable Linear Regression I uses the following: =LINEST(Y,X1:X4,TRUE,TRUE) and I get the correct information. In the case of the Quadratic I don't know how to calculate. I found the following solution =LINEST(Y_1,X_1^{1,2}); but I don't know how to do it and I need to make this calculation with the Cubic,Power and Log regression.

I will appreciate your support on this.

Best Regards.
 
Do the squaring (cubing, logging, etc-ing) yourself, and put the results into the table of independent variables that you feed into LINEST().

Or am I missing something?
 
You can generate the values for a non-linear regression on the spreadsheet, but you don't need to.

See Using LINEST for non-linear curve fitting
which has a spreadsheet for download with examples of all the available non-linear curve types.

If anything isn't clear, please ask.

Doug Jenkins
Interactive Design Services
 
Denial: Thank you and think that could be a option, but I would like to make more quickly.

IDS: Thank you. Actually I'm using that spreadsheet, but it has only one X's and that's the reason that I need to know how to do it with more that 2 X's.
 
If you want to get a regression for (for example) y = aX_1 + bX_1^2 + cX_2 +dX_2^2 + e then denial's way is probably the simplest way to do it.

When you have a single X variable, say in A1:A10, then the formula (A1:A10)^{1,2} returns a two column range with x in the first column and x^2 in the second. You can use this in the regression formula, or enter it directly on the spreadsheet (using ctrl-shift-enter), and use that range in the regression formula.

I was about to say that this doesn't work with a multi-column range for x, but you can actually get it to work. If you have say X_1, X_2 and X_3 in range A1:C10, then copy that range to D1:F10, then you can use: =LINEST(Y_Range,A1:F10^{1,1,1,2,2,2}). It would be good if A1:C10^{1,1,1,2,2,2} returned a 6 column range, in the same way that (A1:A10)^{1,2} returns a two column range, but it seems it doesn't work that way.

There may be another trick to get this to work without any copying of data, but a quick search didn't find anything.

Doug Jenkins
Interactive Design Services
 
Status
Not open for further replies.

Part and Inventory Search

Sponsor

Back
Top