EagerBeaver77
Student
- May 23, 2025
- 2
Hi everyone,
Background:
I’m currently working on a school project where I aim to build an Artificial Neural Network (ANN) that can predict the Park-Ang Damage Index (DI) for simple 1–3 story RC structures. This ANN will be potentially useful in preliminary seismic assessment, retrofitting prioritization, evacuation decision-making, and DI based hazard mapping. To train the ANN, I’ll need a large dataset, so I’m developing a fast, general, and automatable procedure to calculate DI. Currently i am using pushover analysis in ETABS with auto plastic hinges + N2 method to estimate the structures' nonlinear displacements, and then calculate the DI. Manually defining plastic hinges (providing P-M2-M3 and moment-curvature datapoints) would not be very practical to churn out large dataset.
Problems:
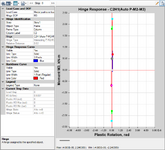
Before running the analysis, the backbone curves of the generated plastic hinges looked normal (see Image A). However, after the analysis, some column plastic hinges showed backbone curves that collapsed (or nearly collapsed) into a vertical line (see Image B). Is this behavior normal, or does it indicate a problem in modeling or analysis setup? If it’s a problem, what might be causing it and how can I fix it?
Additional information:
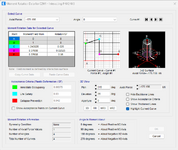
- I’ve attached Image C, which shows the parameters I used for the column plastic hinges.
- I'm using modal load type for the nonlinear static load case. Since the models are simple structures, where the first mode generally dominates, I've based the load case on the first mode.
- For the solution scheme, I'm using "event-to-event only" and I've also adjusted the parameters to make the result more accurate (lowering event-lumping tolerances, increasing maximum events per step, lowering minimum event step size, etc).
- I’ve also tried deleting and redrawing the elements where this strange behavior appears, but the issue still persists.
Image A:

Image B:

Image C:

Note:
- "Gravity" is a linear static load case consists of 1*live load + 1*dead load + 1*super dead load.
- "Modal pushover load" is the nonlinear static load case for the pushover analysis.
Thank you so much!
Background:
I’m currently working on a school project where I aim to build an Artificial Neural Network (ANN) that can predict the Park-Ang Damage Index (DI) for simple 1–3 story RC structures. This ANN will be potentially useful in preliminary seismic assessment, retrofitting prioritization, evacuation decision-making, and DI based hazard mapping. To train the ANN, I’ll need a large dataset, so I’m developing a fast, general, and automatable procedure to calculate DI. Currently i am using pushover analysis in ETABS with auto plastic hinges + N2 method to estimate the structures' nonlinear displacements, and then calculate the DI. Manually defining plastic hinges (providing P-M2-M3 and moment-curvature datapoints) would not be very practical to churn out large dataset.
Problems:
Before running the analysis, the backbone curves of the generated plastic hinges looked normal (see Image A). However, after the analysis, some column plastic hinges showed backbone curves that collapsed (or nearly collapsed) into a vertical line (see Image B). Is this behavior normal, or does it indicate a problem in modeling or analysis setup? If it’s a problem, what might be causing it and how can I fix it?
Additional information:
- I’ve attached Image C, which shows the parameters I used for the column plastic hinges.
- I'm using modal load type for the nonlinear static load case. Since the models are simple structures, where the first mode generally dominates, I've based the load case on the first mode.
- For the solution scheme, I'm using "event-to-event only" and I've also adjusted the parameters to make the result more accurate (lowering event-lumping tolerances, increasing maximum events per step, lowering minimum event step size, etc).
- I’ve also tried deleting and redrawing the elements where this strange behavior appears, but the issue still persists.
Image A:

Image B:

Image C:

Note:
- "Gravity" is a linear static load case consists of 1*live load + 1*dead load + 1*super dead load.
- "Modal pushover load" is the nonlinear static load case for the pushover analysis.
Thank you so much!
