Hi everyone,
I am facing a problem in extracting total axial shortening results from Etabs. I have plotted the total shortening for one of the vertical members by extracting the Uz value from joint displacement table in Etabs (Graph on the right).
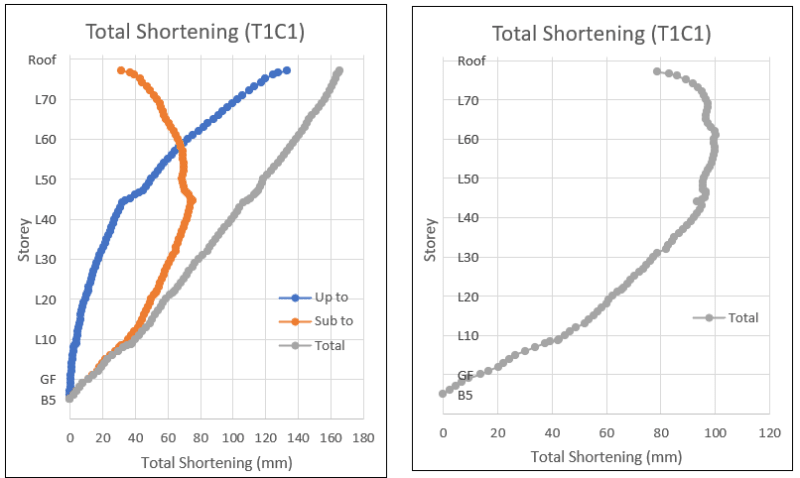
The graph on the left is plotted by a previous consultant. As you may see, my total shortening graph looks more similar to the 'sub to' shortening graph on the left. Anyone could advice on how to get to the 'total' shortening graph which should be increasing all the way up the stories?
I am facing a problem in extracting total axial shortening results from Etabs. I have plotted the total shortening for one of the vertical members by extracting the Uz value from joint displacement table in Etabs (Graph on the right).
The graph on the left is plotted by a previous consultant. As you may see, my total shortening graph looks more similar to the 'sub to' shortening graph on the left. Anyone could advice on how to get to the 'total' shortening graph which should be increasing all the way up the stories?