These graphs are based on Lateral Torsional Buckling equations, which are given by AISC if you are in the US. That's what I know best, but I'm sure it is relatively similar in whatever design code you are being taught (likely different since I see the metric units on your example chart).
AISC 360 is the specification manual for steel construction (If you have an AISC steel manual, it's towards the back)
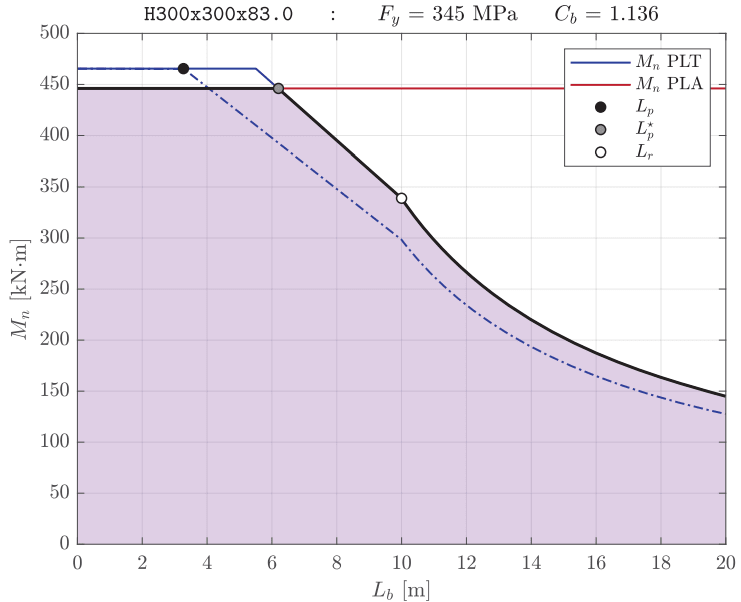
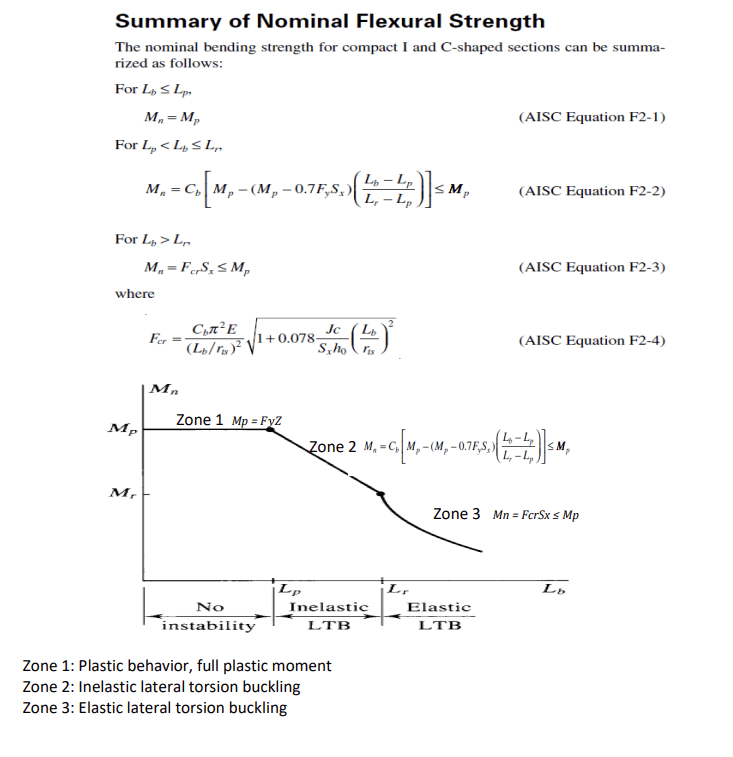
For example, a wide flange would use equations F2-1, F2-2 and F2-3 to calculate the moment capacity of a beam depending on the unbraced length of that beam. Lp and Lr are defined limits based on the cross section dimensions and material, which can be calculated using F2-5 and F2-6 for a wide flange. (Sorry I don't have screenshots of the equations unfortunately)
So once you have all those equations on hand, you could just set an input table with various "x-values" of unbraced length, use your spreadsheet/code to calculate the Lp and Lr limits, and then plug the x-values into the design equations to get your "y-values," your moment capacity.
If Lb is below Lp, you use one equation, if it is between Lr and Lp, you use a second equation, and if it is greater than Lr you use a third equation. Note that some of these equations require some extra bits of calculation to be performed that you will need to include in your code/spreadsheet.
Then just plot your x and y values as you would with any chart! Increase the density of your points if it's too grainy, this is pretty easy when coding using linspace (if I remember the correct python command) but can be done manually too.