rvprrone76
Student
Hello all,
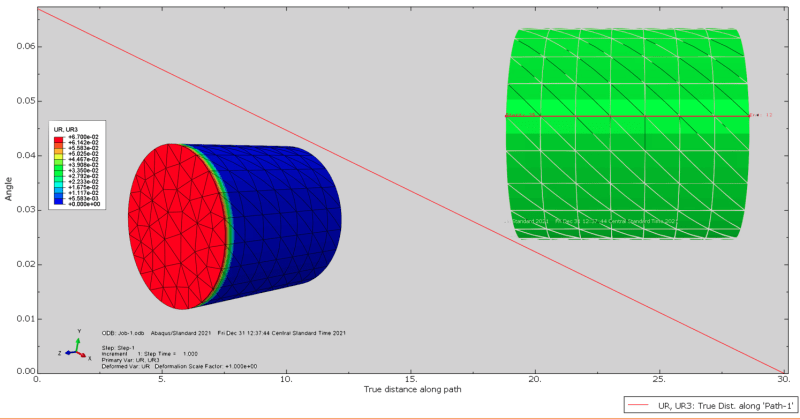
I modeled the simple torque a shaft. The results should be linear but my contour plot shows the change to have only occurred through the first element of the shaft and not the entire shaft. The values of the output (UR, UR3) are correct, but the contour plot of the whole shaft should reflect the linear change seen in the legend not just the first element. I plotted the angle of twist along a path of nodes which confirms the increasing angle of twist is linear. Is there a way to get the contour plot to reflect this more accurately?
Kind regards,
RP