sticksandtriangles
Structural
Finally starting to get around to making GUIs/graphs in python and I want to bring in the nice navigation tool bar that i have seen in the matplotlib "pacakge" (not sure if package is the right term?).
My code looks like the following taken from an example online with small modifications to bring in the navigation toolbar.
Above, I've highlighted in red the lines of code I've added. My graph looks like the following:

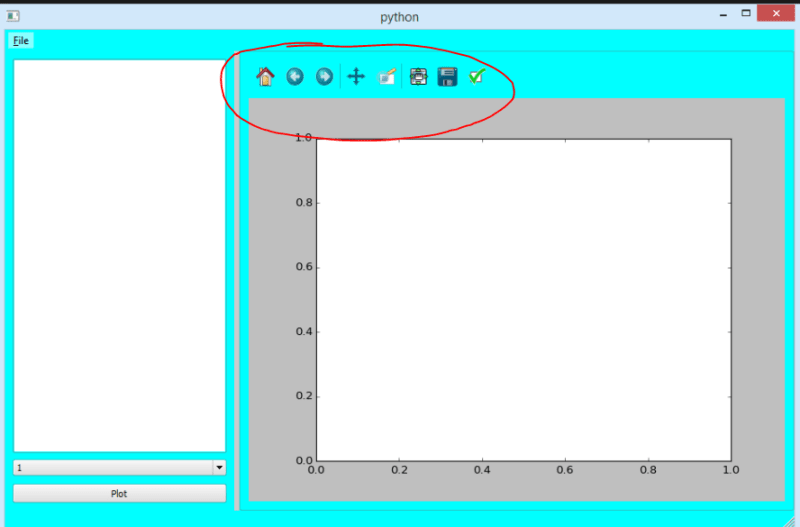
The navigation bar, from my understanding, would be at the top of the graph and look like:
Any ideas on where I went wrong?
Thanks!
S&T
My code looks like the following taken from an example online with small modifications to bring in the navigation toolbar.
Python:
import matplotlib.pyplot as plt
import random

class App(QMainWindow):

    def __init__(self):
        super().__init__()
        self.left = 100
        self.top = 100
        self.title = 'PyQt5 matplotlib example - pythonspot.com'
        self.width = 640
        self.height = 400
        self.initUI() #not sure what this line of code does
[COLOR=#EF2929]        self.fig=Figure()
        self.canvas=FigureCanvas(self.fig)
        #add plot toolbar from matplotlib
        self.toolbar = NavigationToolbar(self.canvas, self)[/color]

    def initUI(self):
        self.setWindowTitle(self.title)
        self.setGeometry(self.left, self.top, self.width, self.height)

        m = PlotCanvas(self, width=5, height=4)
        m.move(0,0)

        button = QPushButton('PyQt5 buttons', self)
        button.setToolTip('This is an example button')
        button.move(500,0)
        button.resize(140,100)

        self.show()


class PlotCanvas(FigureCanvas):

    def __init__(self, parent=None, width=5, height=4, dpi=100):
        fig = Figure(figsize=(width, height), dpi=dpi)
        self.axes = fig.add_subplot(111)

        FigureCanvas.__init__(self, fig)
        self.setParent(parent)

        FigureCanvas.setSizePolicy(self, QSizePolicy.Expanding,QSizePolicy.Expanding)
        FigureCanvas.updateGeometry(self)
        self.plot()


    def plot(self):
        data = [random.random() for i in range(25)]
        ax = self.figure.add_subplot(111)
        ax.plot(data, 'r-')
        ax.set_title('PyQt Matplotlib Example')
        self.draw()

if __name__ == '__main__':
    app = QApplication(sys.argv)
    ex = App()
    sys.exit(app.exec_())
Above, I've highlighted in red the lines of code I've added. My graph looks like the following:
The navigation bar, from my understanding, would be at the top of the graph and look like:
Any ideas on where I went wrong?
Thanks!
S&T