Maximum Inertial Load
(OP)
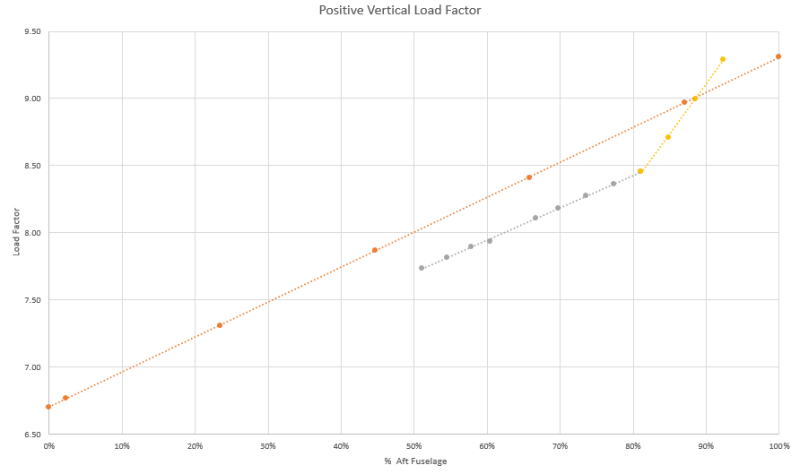
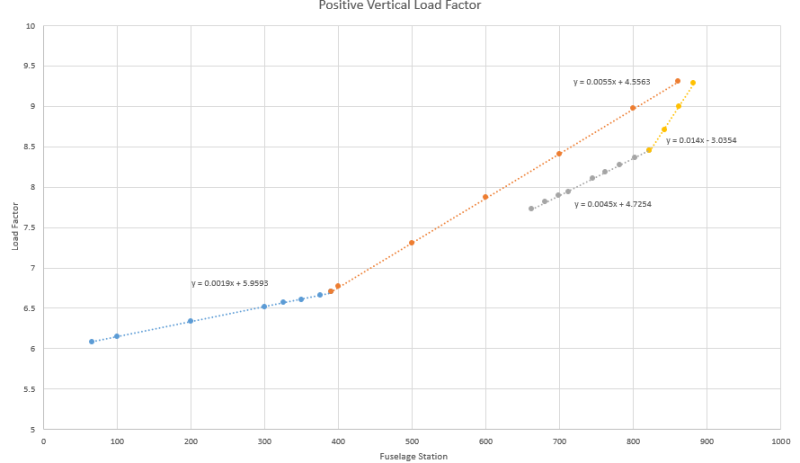
See image. The blue & orange curves represent + ultimate load factor curves for the shorter, lighter model of a type. The grey and yellow is for the longer, heavier model of the same type for which I just have some tabulated data. Both derivatives share common cg (x394). The shorter model distribution makes sense. The grey curve for the longer model makes sense too given the higher mass moment of inertia. But I don't understand the sudden change in the three last data points represented by the yellow curve. The tabulated maximum ultimate loads for the longer model are all given from the same yz axis. The slope change does occur just forward of the t-tail horizontal stabilizer.

I think I'm missing something fundamental here - is it obvious to others?

I think I'm missing something fundamental here - is it obvious to others?
RE: Maximum Inertial Load
Cheers
Greg Locock
New here? Try reading these, they might help FAQ731-376: Eng-Tips.com Forum Policies http://eng-tips.com/market.cfm?
RE: Maximum Inertial Load
why does the load kick up towards the tail ? maybe ditching ? maybe dynamic landing ?
another day in paradise, or is paradise one day closer ?
RE: Maximum Inertial Load
My turn for a WAG: Fuselage elastic flex and recoil. I think an effect like that would be X^2 with length, but very small for most of the fuselage. You said this is a stretched fuselage, so maybe that effect begins to matter when it gets >40 feet from the spar.
STF
RE: Maximum Inertial Load
It looks like 2 super imposed load cases. The gray line is 6.5G at the CG and yellow is 2.48 G so I would guess that the yellow is a pitch related load at maximum maneuvering load and the gray emergency landing maybe.
RE: Maximum Inertial Load
another day in paradise, or is paradise one day closer ?