Eng-Tips is the largest forum for Engineering Professionals on the Internet.

Members share and learn making Eng-Tips Forums the best source of engineering information on the Internet!

  • Congratulations JStephen on being selected by the Eng-Tips community for having the most helpful posts in the forums last week. Way to Go!

Typical Generator X over R ratio Clarification in IEEE 399 1

Status
Not open for further replies.

Wfg42438

Electrical
Joined
Apr 10, 2017
Messages
70
Location
US
Hello Everyone,

I just wanted to see if anyone out there may be able to clarify a question I have about Fig 1-36 in IEEE 399-1997.

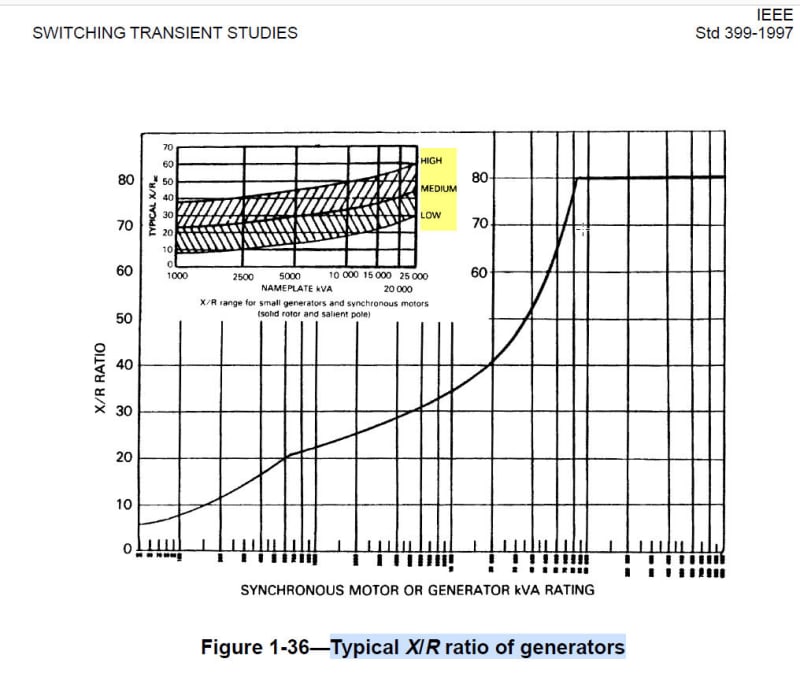
In this Figure, they specify typical X/R ratios for Generators, and for small generators, they have "Low", Med" and "High" curves.

Does anyone know what these individual curves represent?

Gen_XoverR_ztirlv.jpg
 
They are just providing an approximate range for smaller machines. I wouldn't read too much into it.
 

The curve shown was developed using statistical data from rotating machines manufacturers in north America in the 50´s and 60´s.

In absence of better information, this values can be used in the early stage of the project as unconfirmed assumption to be verified after test
 
Thanks for the background info on the curves.

When using these as references how would I know which of the curves is applicable to me?

What exactly tells me to use the low, medium or high curve?
 
Use the worst one for what ever you’re considering. Like using the low end of an impedance range for fault calculations and the high end for load flow studies.

I’ll see your silver lining and raise you two black clouds. - Protection Operations
 
I see what you mean we take the conservative approach based on the "High" curve.

Seems like its a drastic difference in each case, I wonder if "high" value would overly conservative.

Thank you for the input!
 
Status
Not open for further replies.

Part and Inventory Search

Sponsor

Back
Top