H
haroonstr19
Guest
Hi,
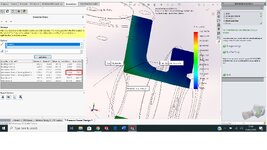
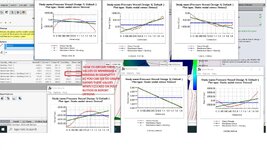
I am trying to plot the stress intensity through stress linearization method.
The actual values for membrane stress + bending stress at point 1 and 2 are not showing up on the graph.
I am new to solidworks simulation and know only FEA to the basic level.
Please can you advise how to get the values on the graph ...as you can see in the pics attached the graph doesnt the values in psi.
Thanks,
Haroon
View attachment 2384
View attachment 2385