There are lots of ways to present the data.
Here's one way assuming you want to find T2 in general.
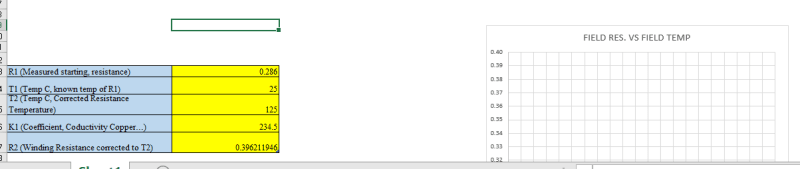
R2 = R1 (234.5+T2)/(234.5+T1)
Switch roles of 1 and 2 (it just makes the algebra easier)
R1 = R2 (234.5+T1)/(234.5+T2)
Multiply by (234.5+T2)/R1
(234.5+T2) = R2/R1 (234.5+T1)
Subtract 234.5
T2 = (R2/R1) (234.5+T1) -234.5 [EQ1]
Plot a family of curves T2 vs T1 where (R2/R1) is the parameter that changes for each curve of the family.
(now that i think about it, they're not really curves, just lines with slope R2/R1)
When given R1, R2, and T1, you can compute R1/R2 yourself and read straight up from the T1 value to the line that matches your R1/R2 and then read straight left to the vertical axis to find T2.
That will work even with a graph that you print out.
If you're letting yourself do each case in excel, then of course excel can find R1/R2 for you... but in that case I have to ask why you need a chart (you just need a formula EQ1 with 3 inputs and one output).
Now that I ask myself that question, it makes me wonder if we've misunderstood the question. Maybe you want to estimate the winding temperature when running by recording the resistance over time after the motor is shutdown? In that case the horizontal axis is time and you're plotting points vs time after shutdown and extrpolating backwards to t=0 time of shutdown. IIRC there is a shortcut where you can use a a straight line to extrapolate backwards if you're using a log scale. If you clarify your request then I'm sure someone will illuminate that procedure.
=====================================
(2B)+(2B)' ?