Hi,
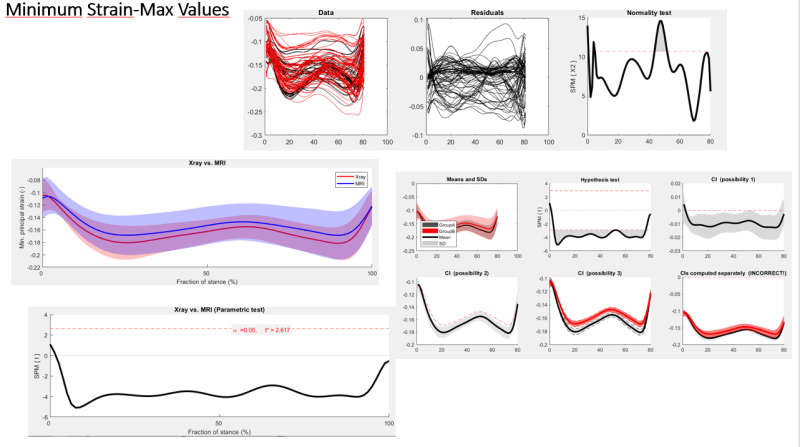
I am simulating minimum principal strain of knee models. I am getting different graphs for Confidence intervals (showing statistical difference between MRI and X-ray based models) and parametric test graphs(no significant difference). Can someone explain me how to interpret these graphs.
I am simulating minimum principal strain of knee models. I am getting different graphs for Confidence intervals (showing statistical difference between MRI and X-ray based models) and parametric test graphs(no significant difference). Can someone explain me how to interpret these graphs.