Continue to Site

Eng-Tips is the largest engineering community on the Internet

Intelligent Work Forums for Engineering Professionals

  • Congratulations cowski on being selected by the Eng-Tips community for having the most helpful posts in the forums last week. Way to Go!

Advanced Regression - Deriving New Equations

Status
Not open for further replies.

teknomania

Mechanical
Nov 22, 2007
26
Hello,
During my tasks in different disciplines, I am reaching some new performance measure as according to the topic studied. I already used multi-regression in some and, if that was not enough to fit my data, I used interpolation method 'The Vandermonde Method' and lately discovered the powerful griddata function by Matlab.

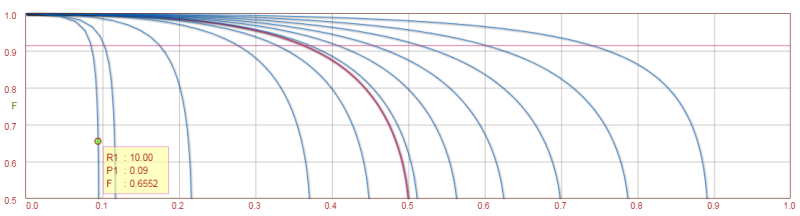
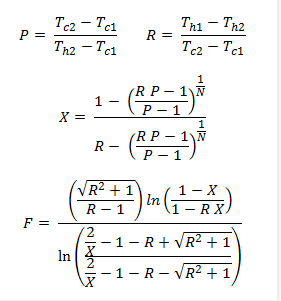
I need to derive new expression/equations for the data I reach each time (like regression coefficients so that I can use them in my model). My question arises since I have no idea how the old scientists could find the advanced expressions for their data (Please check the formulations below). For example, how one could put the relation for the correction factor as a function of R and P as given below. As you can see, the relations of R and P with correction factor is not straightforward to be understood. Normally the curve of correction factor seems to be power-like regression for each P with changing R values. But the formulation below is totally out-of-world.

I believe that there is a topic in mathematics like regression, interpolation etc. for such expression deriving. Checked google but couldn't find anything. Any help, guidance can be rewarding.

In Example:
Nusselt correlations
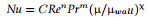
2017-06-09_16_33_48-JEH2205_4_-15947_1_.pdf_bmwtbx.png

or
Correction Factor - LMTD Theory(most inspiring one) :)
2017-06-09_16_38_26-Corrected_Log_Mean_Temperature_Difference_for_Shell-and-Tube_Heat_Exchangers___E_mmyruk.png


“In life, the truest guide is science” – Mustafa Kemal Atatürk
 
Replies continue below

Recommended for you

Insight ? looking at the data, what curve does it look like ? how if the data in plotted on log axes (or log/linear) ?

Knowing what the relationship should be from theory, then tweeking it.

another day in paradise, or is paradise one day closer ?
 
One of my old text "Probability and Statistics" authored by I. Miller and JE Freund, 1965 has a whole section devoted on curve fitting. Multiple regression will solve your Nusselt equation but it has to be transform in an equivalent linear equation using, preferably, in my case natural log. Then you can apply gauss elimination to get sets of triangular equation for back substitution of the coefficients.
 
I need to spend time to have the understanding for this curve/data fitting topic. It is a must to have a reliable model as according to your system/simulation. Thank you for your helps.
Regards.

“In life, the truest guide is science” – Mustafa Kemal Atatürk
 
The text book "Probability and Statistics for Engineer" that I mentioned above has a comprehensive section on curve fitting with lots of exercises. Another excellent source of reference is the Perry Chemical Engineering Handbook. Reading these two references is not for the faint hearted people. From these two references, I personally spent a few months developing a program in BASICS several years ago to solve polynomial, reciprocal, rational, exponential, power, log normal, gamma and weibull equations, well before MS EXCEL came up with their curve fitting progam.
 
I don't think there's a single answer to your question.
If you start off with nothing but a bunch of data points and derive an expression to represent them, you'll generally wind up with a fairly simple expression= and the more scattered the points are, the simpler the expression.
If the problem at hand has an approximate solution, the expression may come from that.
For example, the "exact" solution to the idealized problem may be a power series or double power series, and taking the first one or two terms of that may be used as the basis of the approximation.
If the problem is non-dimensionalized, that affects the form of the solution.
If a curve is graphed on log paper, those exponents are just multipliers on the graph.
 
HP used to publish a booklet on curve fitting for their programmable calculators; would this be of any use?

Dik
 
Thank you for your helps.
It will be rewarding to give the correction factor curve, its expression being the formulation that I did submit in my first post (but giving here as well).
They seem to have a characteristic of an exponential function for each curve (considering some coefficients being negative). So I tried to fit the data for my custom function a exp (b x + c) + d for each line in the graph (by use of Matlab optimization tool) and obtained (for two lines) that only the coefficients b and c change with changing lines. It results something but I didn't get satisfied with that. The custom function was generated by use of info given at Nancy Marcus - Graphs of Exponential Functions.
2017-06-22_10_06_52-Logarithmic_Mean_Temperature_Difference_LMTD_Correction_Factor_Charts_n7odmg.png

2017-06-09_16_38_26-Corrected_Log_Mean_Temperature_Difference_for_Shell-and-Tube_Heat_Exchangers___E_mmyruk.png


“In life, the truest guide is science” – Mustafa Kemal Atatürk
 
What you want to search of is system identification. First you need an equation or model for which you want to find the coefficients. It looks like you have that.
Then you need to have a cost function that grows bigger as a function of error. Usually the cost function is a sum of errors between the actual and estimated values for each parameter/coefficient you want to identify. A good algorithm to start with is BFGS. Matlab should have a routine that uses the BFGS algorithm. A simpler algorithm is Levenberg-Marquardt. Don't try to understand the math behind these algorithms. Just look in Matlab do see how Matlab implements these algorithms.

If you want to get a gut feel for what is going on then look at this first
You will see that I too lay it out like a grid or map to show the basics.
However, when identifying many coefficients the grid isn't practical and the more advanced algorithms must be use.

These algorithms are the same ones control guys use to find a model for the system they are trying to control which is basically what you are trying to do.


Peter Nachtwey
Delta Computer Systems
 
Status
Not open for further replies.

Part and Inventory Search

Sponsor